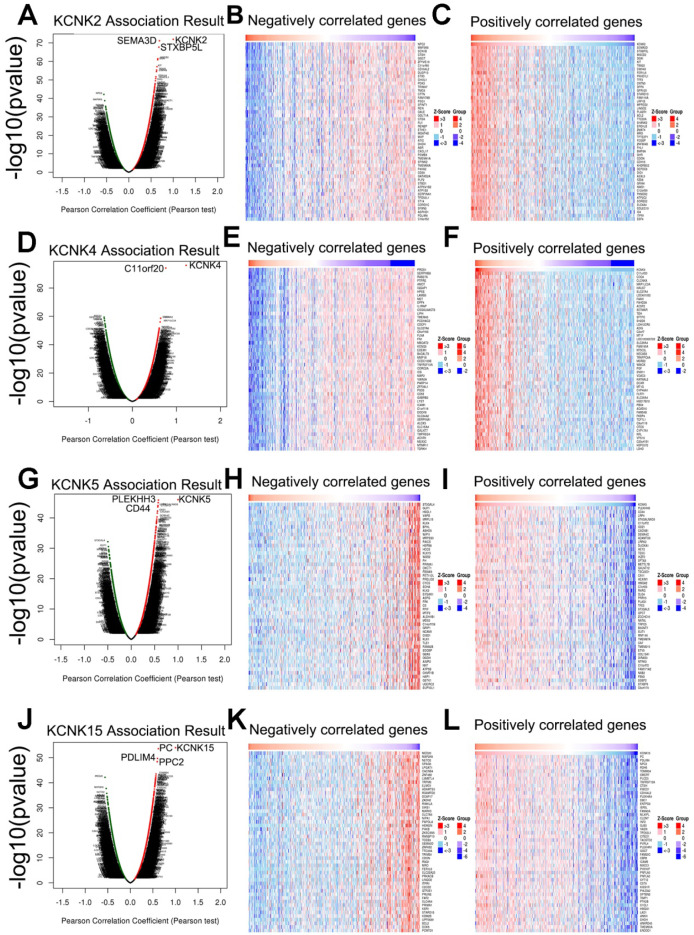
Figure 7.
Genes differentially expressed in correlation with KCNK2/4/5/15 in thyroid carcinoma (LinkedOmics). (A, D, G, J) The correlation between KCNK2/4/5/15 and differentially expressed genes was analyzed by the Pearson test analysis in volcano plots. (B, C, E, F, H, I, K, L) The heatmap showing the top 50 genes negatively or positively correlated with KCNK2/4/5/15.

