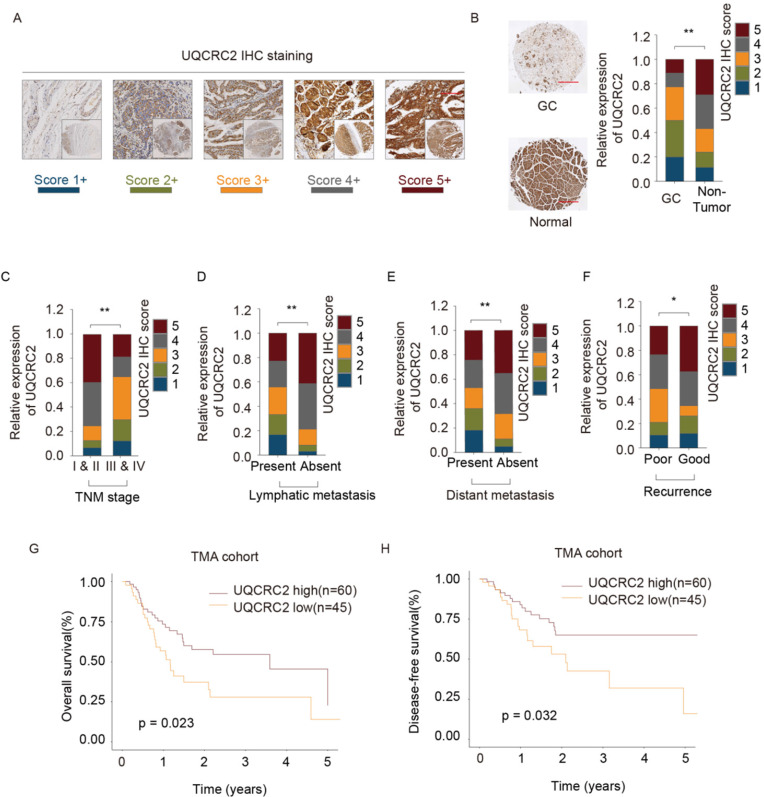
Figure 2.
UQCRC2 levels correlated with clinicopathological features of GC. (A, B) Typical immunohistochemical staining of UQCRC2 in human GC and normal para-carcinoma tissue specimens in the tissue microarray cohort. The scores represent the intensity and frequency of UQCRC2 staining in gastric tissues. (C-F) Visual presentation of the relationship between UQCRC2 levels and clinicopathological features (TNM stage, lymph node metastasis [LNM], distant metastasis [DM], and relapse). (G,H) Over-expression of UQCRC2 was usually detected in patients with increased OS (HR=1.51, 95%CI [1.26-1.8], P < 0.05) and DFS (HR=2.09, 95%CI [1.73-2.52], P < 0.05) in the tissue microarray cohort, as suggested by Kaplan-Meier analysis.

