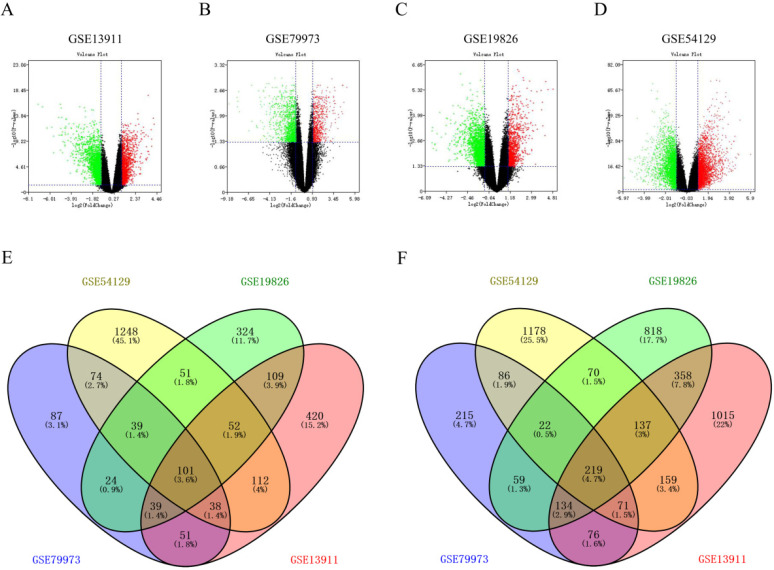
Figure 1.
Screening for significant DEGs in gastric cancer. (A-D) Volcano plots from four datasets (GSE13911, GSE79973, GSE19826 and GSE54129). X axis represents the p-value of the logarithmic transformation, and Y axis represents the average gene expression differences between gastric cancer samples and normal samples. The four volcano plots showed all DEGs; red dots and green dots represent the up-regulated and down-regulated genes in gastric cancer samples, respectively; black dots represent genes that are not differentially expressed between gastric cancer samples and controls. |log2FC| >1 and p-value < 0.05 were set as the cut-off criteria. (E-F) Venn diagrams of up-regulated and down-regulated DEGs from four GSE datasets. The genes taking the intersection are considered to be significant DEGs.

