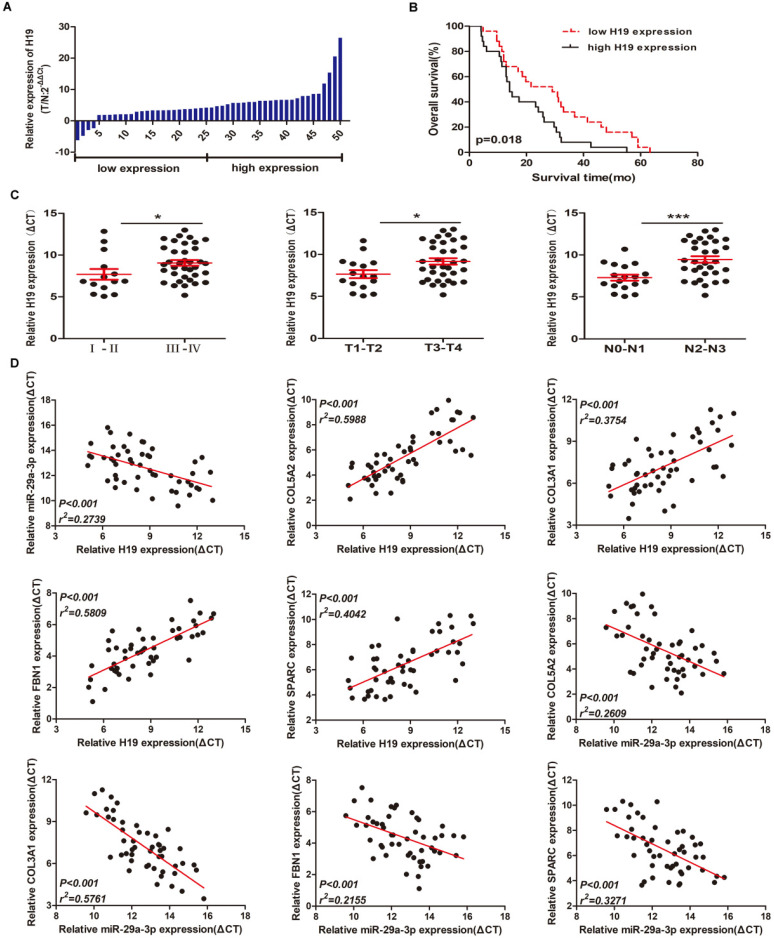
Figure 7.
Preliminary validation of the mRNA-miRNA-lncRNA network in gastric cancer tissue samples. (A) H19 expression in GC tissues (n = 50) compared with normal tissues (n = 50) was examined by qRT-PCR and normalized to GAPDH expression. (B) Kaplan-Meier overall survival curves according to H19 expression levels. (C) The relationships between H19 expression and clinicopathological characteristics (TNM stage, primary tumor and lymph nodes). (D) Spearman correlation analysis among the expression of H19, miR-29a-3p and mRNAs (COL3A1/FBN1/COL5A2/SPARC).

