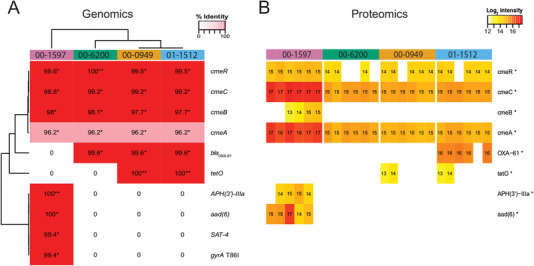
Figure 1.

Genomic and proteomic searches of CARD for AMR screening. A) Heatmap of AMR protein sequences identified in WGS data of Campylobacter isolates using RGI v4.0.1. Each cell is labeled and shaded from red to pink representing their percent identity match to CARD as indicated in the legend. Only perfect (**) and strict (*) matches as reported by RGI are coloured; entries without a protein sequence match in an isolate are uncoloured. B) Heatmap of AMR protein abundance detected using FDR = 0.01 and an additional presence cut‐off in isolates with six biological replicates. The log2 relative intensities are labeled in each cell and colored in a gradient from red to yellow indicating higher and lower abundance, respectively. Proteins with significant abundance variation among groups as tested with ANOVA (Benjamini–Hochberg adjusted p ≤ 0.05) are marked with an asterisk.
