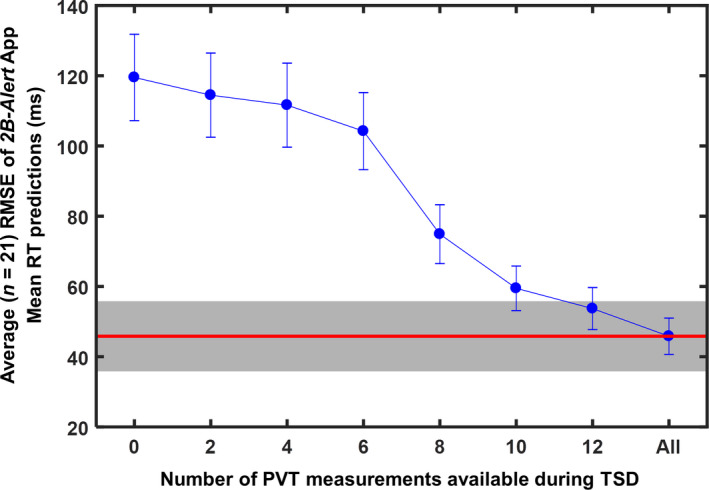
Figure 4.

Average (n = 21) root mean squared error (RMSE) of 2B‐Alert App individualized mean response time (RT) predictions for the last 24 hr of total sleep deprivation (TSD), as a function of the number of PVT measurements available (and used by the app) during TSD for model customization. The first (leftmost) RMSE corresponds to predictions based on models customized using the at‐home phase of the study. Error bars indicate one standard error. The red horizontal line indicates the average RMSE of the best‐fit model, and the grey shaded bar represents a range of ±10 ms within the average best‐fit RMSE
