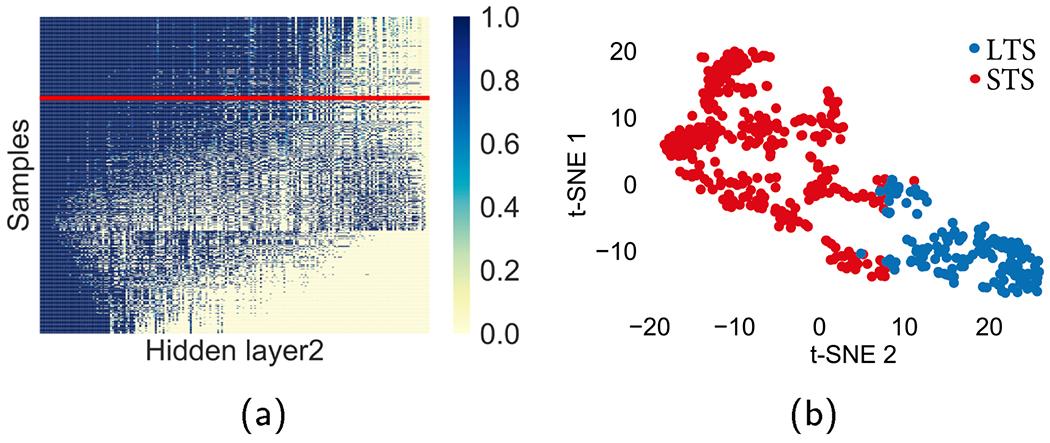
Fig. 9.

Visualization of the nodes in the last hidden layer. The line in red separates the samples of the two clusters. (For interpretation of the references to colour in this figure legend, the reader is referred to the web version of this article.)
