Table 1.
Initial Optimization of Lead Compound 1
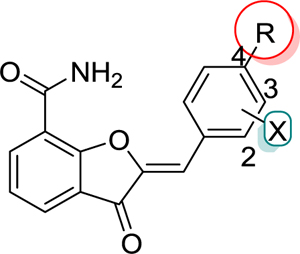 |
||||||
|---|---|---|---|---|---|---|
| Compd | X | R | PARP-1 IC50 (nM)a | pIC50 ± S.D (nM) | PARP-2 IC50 (nM)a | pIC50 ± S.D (nM) |
| 1 | H | -H | 434 | 6.41 ± 0.20 | NT | - |
| 48 | H | 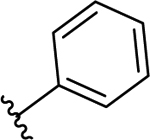 |
>50 (2%b) | - | NT | - |
| 49 | H | 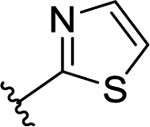 |
>50 (7%) | - | NT | - |
| 50 | H | 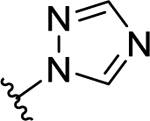 |
>50 (5%) | - | NT | - |
| 51 | H | 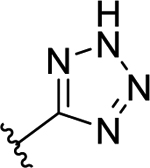 |
35 | 7.50 ± 0.20 | 2.1 | 8.69 ± 0.01 |
| 52 | H | 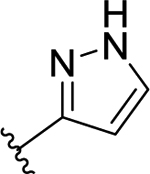 |
>50 (4%) | - | NT | - |
| 53 | 3-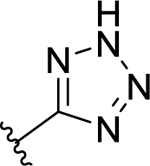
|
-H | >50 (14%) | - | <50 (76% c) | - |
| 54 | H | 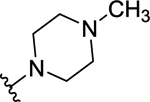 |
>50 (7%) | - | NT | - |
| 55 | H |  |
>50 (10%) | - | NT | - |
| 56 | H | 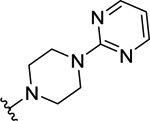 |
>50 (19%) | - | <50 (56%) | - |
| 57 | 3-F | 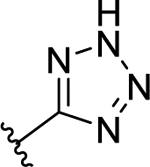 |
56 | 7.28 ± 0.14 | <50 (100%) | - |
| 58 | 2-OCH3 | 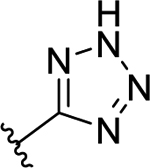 |
47 | 7.33 ± 0.07 | 1.6 | 8.80 ± 0.05 |
| 59 | H | 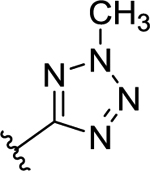 |
>50 (4%) | - | NT | - |
| 60 | H | -COOH | 68 | 7.17 ± 0.08 | NT | - |
| Olad | - | - | 1.2 | 8.93 ± 0.07 | 0.5 | 9.40 ± 0.30 |
| Vele | - | - | 1.5 | 8.83 ± 0.06 | 100% @ 10 nM | - |
Data shown are mean values obtained from two independent experiments performed in duplicates.
% inhibition screening at a single concentration (50 nM unless otherwise specified) was performed in duplicates and data shown is an average of two independent experiments;
% inhibition screening of PARP-2, was performed at 50 nM concentration, in duplicates by one experiment;
Olaparib;
Veliparib;
Not tested (NT).
