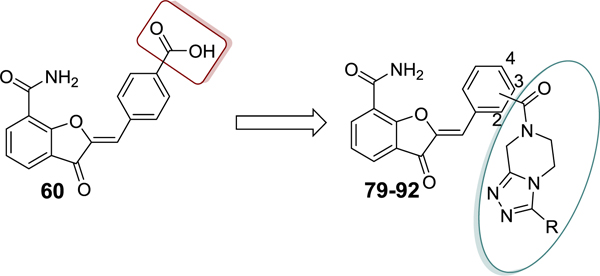
Table 3.
The Effect of 1,2,4-Triazolopiperazine Amide Substituents on the Phenyl Ring of Benzylidene Moiety
 |
||||||
|---|---|---|---|---|---|---|
| Compd | Position | R | PARP-1 IC50 (nM)a | pIC50 ± S.D (nM) | PARP-2 IC50 (nM)a | pIC50 ± S.D (nM) |
| 51 | - | - | 35 | 7.50 ± 0.20 | 2.1 | 8.69 ± 0.01 |
| 60 | - | - | 68 | 7.17 ± 0.08 | NT | - |
| 79 | 4- | -H | 97 | 7.02 ± 0.10 | >10 (18%c) | - |
| 80 | 4- | -CH3 | 81 | 7.10 ± 0.09 | <10 (55%) | - |
| 81 | 4- | -CF3 | 30 | 7.53 ± 0.07 | 2 | 8.80 ± 0.01 |
| 82 | 4- | 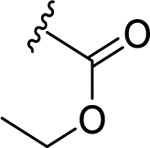 |
40 | 7.42 ± 0.12 | 3.7 | 8.44 ± 0.03 |
| 83 | 4- | 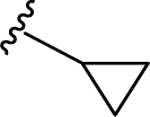 |
27 | 7.57 ± 0.05 | 1.9 | 8.72 ± 0.02 |
| 84 | 4- |  |
>50 (25%b) | - | <10 (59%) | - |
| 85 | 4- | -CHF2 | 30 | 7.52 ± 0.01 | 3 | 8.52 ± 0.03 |
| 86 | 4- |  |
47 | 7.33 ± 0.06 | 3.5 | 8.46 ± 0.04 |
| 87 | 4- |  |
>50 | - | <10 (61%) | - |
| 88 | 4- | 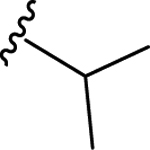 |
42 | 7.43 ± 0.21 | 4.6 | 8.34 ± 0.02 |
| 89 | 4- | 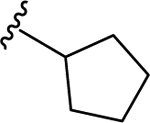 |
37 | 7.48 ± 0.22 | 3.9 | 8.42 ± 0.05 |
| 90 | 4- |  |
32 | 7.55 ± 0.22 | 3.3 | 8.48 ± 0.01 |
| 91 | 3- | -H | >50 (13%) | - | >10 (6%) | - |
| 92 | 3- | -CF3 | 42 | 7.38 ± 0.01 | >10 (47%) | - |
| Olad | - | - | 1.2 | 8.93 ± 0.07 | 0.5 | 9.40 ± 0.30 |
| Vele | - | - | 1.5 | 8.83 ± 0.06 | <10 nM | - |
Data shown are mean values obtained from two independent experiments performed in duplicates.
% inhibition screening at a single concentration (50 nM unless otherwise specified) was performed in duplicates and data shown is an average of two independent experiments;
% inhibition screening of PARP-2, was performed at 10 nM concentration, in duplicates by one experiment.
Olaparib;
Veliparib.
Not tested (NT).
