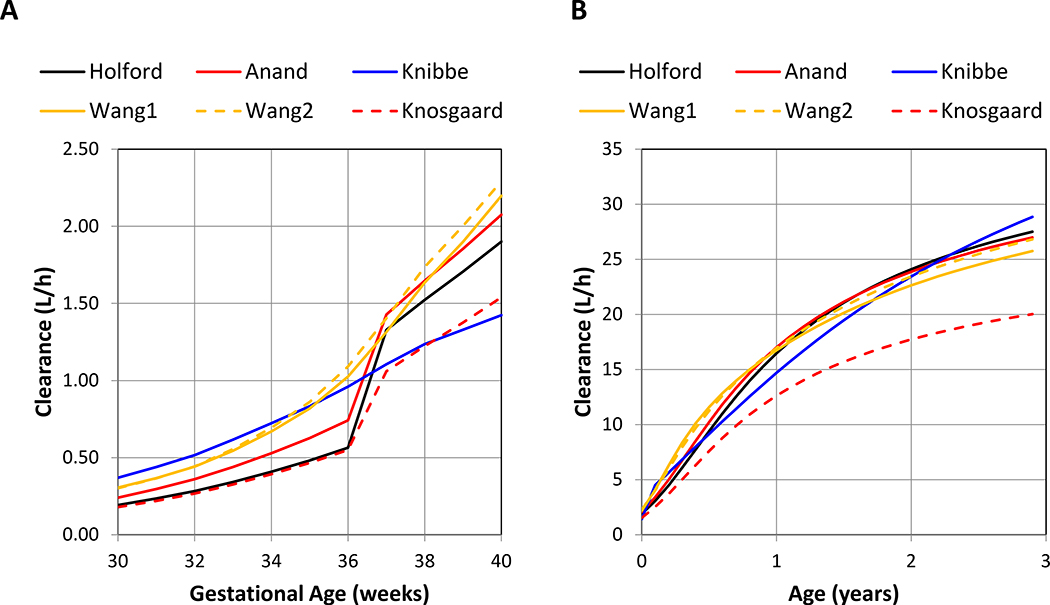
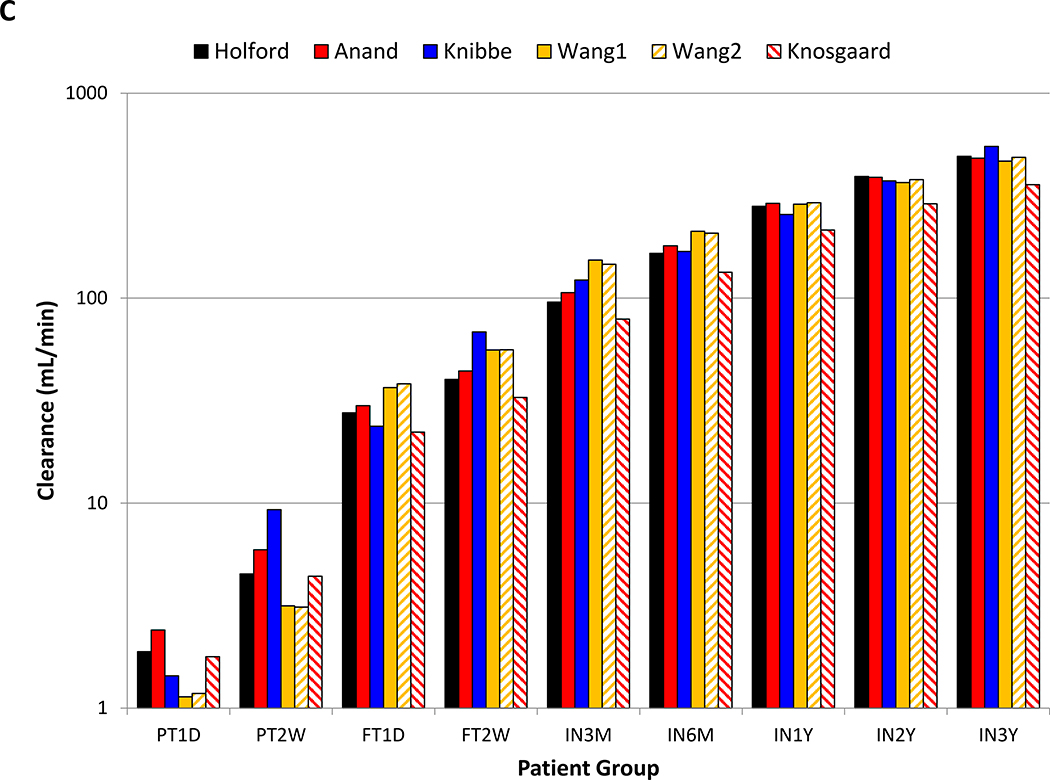
Figure 2.
Summary of internal validation of the morphine population models.
Panels A, present the model predicted morphine clearance estimates (in L/h) as a function of gestational age from 30 to 40 weeks; Panel B, present the model predicted morphine clearance estimates (in L/h) as a function of age from zero to 3 years of age; Panel C, present the model predicted morphine clearance estimates (in mL/min) for each of the nine case examples: a 32 week preterm neonate (PT1D), a 32 week preterm neonates (PT2W), a 38 week term neonate (FT1D), a 40 week term neonate (FT2W), a 3 month old infant born term (IN3M), a 6 month old infant (IN6M), and a one year old infant (IN1Y), a 2 year old infant (IN2Y), and a 3 year old infant (IN3Y).
Patient weight was derived using gestational age (Panel A: data from https://www.momjunction.com/articles/baby-weight-gain-and-weight-chart_00362524/#gref) or the post-natal age (Panel B: standard growth curve).


