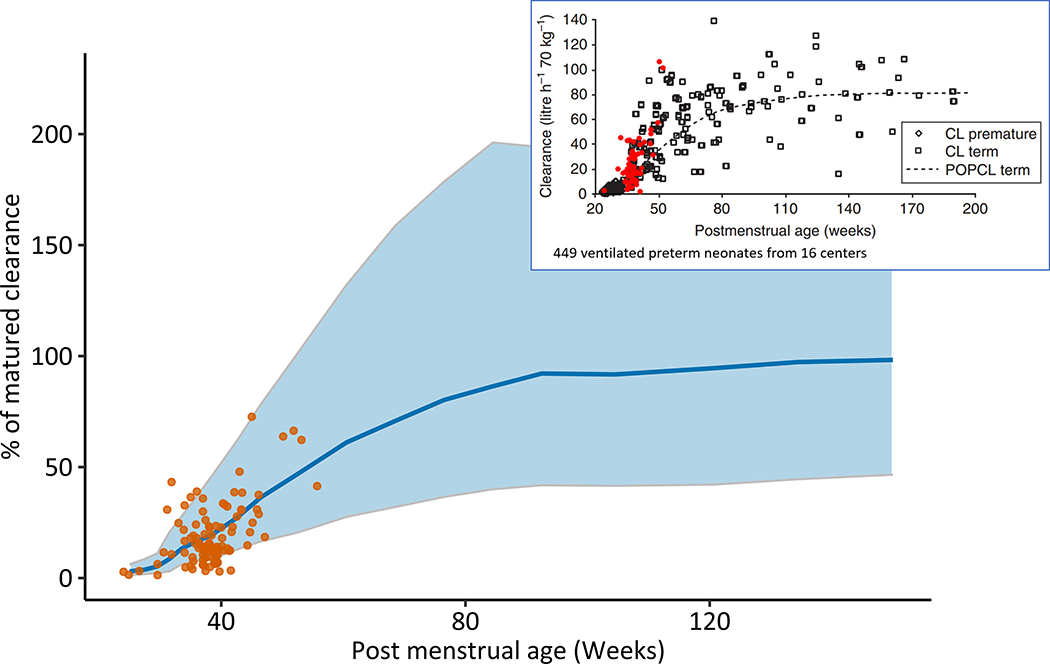
Figure 3.
Morphine clearance estimates generated with the NeoRelief platform versus results from the NEOPAIN study.
Closed circles represent morphine clearance estimates in newborns treated in NICU at Cincinnati Children’s analyzed using NeoRelief and expressed as percentage of the mature morphine clearance (84.2 L/l per 70 kg)(3). The solid line and shaded areas represent the median and 5–95 percentiles, respectively of morphine clearance values simulated using the Anand model. The figure insert shows the original clearance estimate data of the NEOPAIN study with morphine clearance estimates (red symbols) for our neonatal cohort generated with NONMEM(2) and verified with the NeoRelief platform.

