
FIGURE 3.
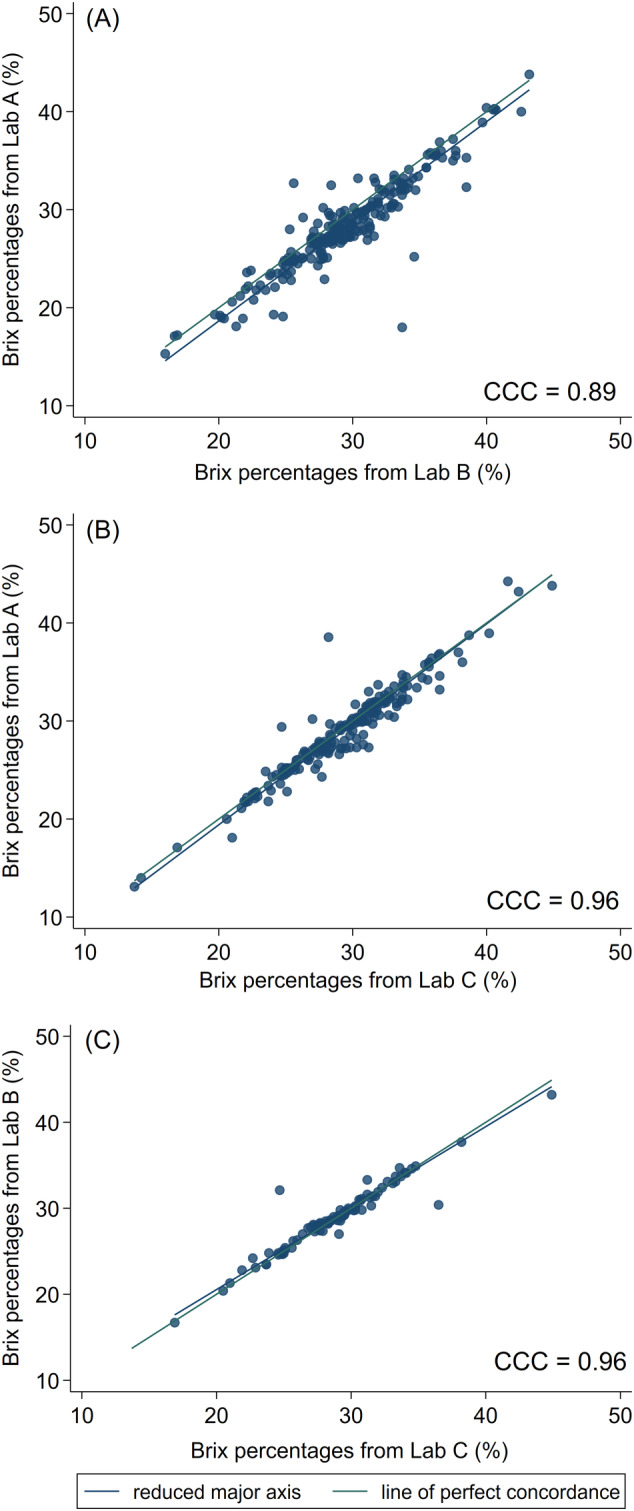
Concordance correlation coefficient plots of Brix percentages (%) measured by Brix refractometers in, A, Lab A and Lab B, B, Lab A and Lab C, and, C, Lab B and Lab C, to estimate IgG concentrations in beef cow colostrum. IgG, immunoglobulin G