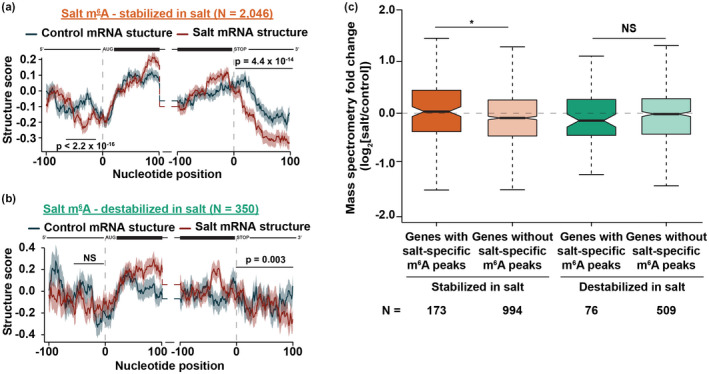
FIGURE 5.

Transcripts that gain m6A and are stabilized upon systemic salt stress response lose RNA secondary structure at the start codon and 3’ UTR and produce more protein. (a,b) Average structure score in control‐treated (blue line) and salt‐treated (red line) tissue in the ±100 nt of the annotated start and stop codon of nuclear protein‐coding transcripts that gain m6A and are stabilized (a) or destabilized (b) during long‐term salt stress response. See Data Set S9. Shading around the line indicates the SEM across all plotted transcripts. p‐values were calculated using a Wilcoxon test and are denoted over the specific regions. mRNA diagrams above plots are not to scale. (c) Protein abundance fold change (log2[salt/control]) for transcripts that contain salt‐specific m6A peaks (darker colors) or lack salt‐specific m6A peaks (lighter colors) and are stabilized (orange) or destabilized (green) during salt stress response. NS and *p > .05 or <.05, respectively, Wilcoxon test. See Data Set S8.
