
Figure 2.
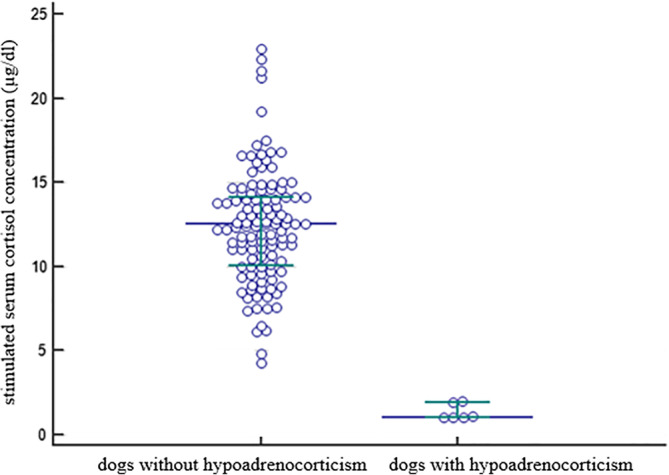
Scatter plot showing stimulated serum cortisol concentrations in 145 dogs without hypoadrenocorticism and 6 dogs with hypoadrenocorticism. The horizontal bars represent the 25% percentile, the median and the 75% percentile
Official websites use .gov
A
.gov website belongs to an official
government organization in the United States.
Secure .gov websites use HTTPS
A lock (
) or https:// means you've safely
connected to the .gov website. Share sensitive
information only on official, secure websites.
Scatter plot showing stimulated serum cortisol concentrations in 145 dogs without hypoadrenocorticism and 6 dogs with hypoadrenocorticism. The horizontal bars represent the 25% percentile, the median and the 75% percentile