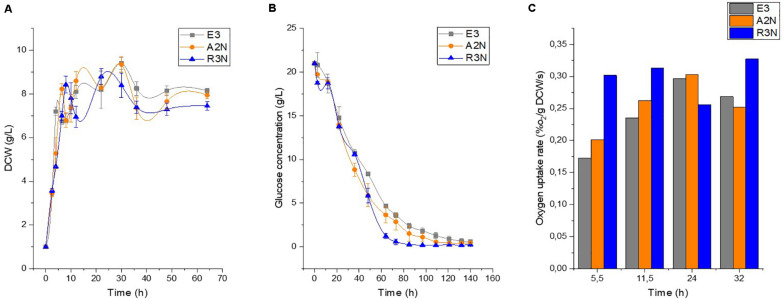
FIGURE 3.
Physiological comparison between E3 and the NOX-expression strains regarding the growth, namely dry cell weight (DCW) (A), the glucose consumption (B), and the oxygen uptake rate (C). Data are shown as mean ± standard deviation from at least three independent experiments for measuring growth and glucose concentration. Oxygen utilization was obtained from duplicate experiments.

