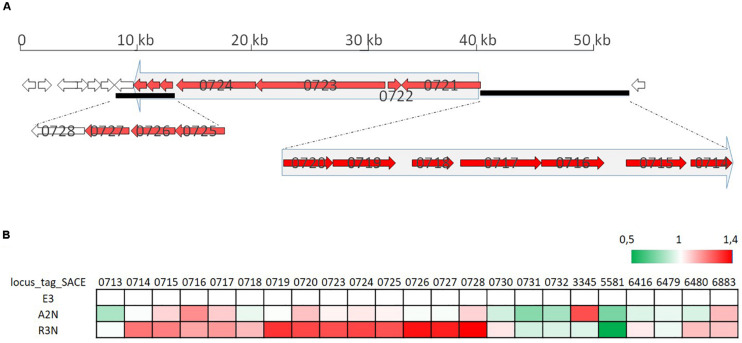
FIGURE 8.
Organization of the erythromycin biosynthesis gene cluster (A) and its transcription profiles (B). Small arrows in (A) indicate coding regions of the erythromycin biosynthesis gene cluster and numbers on arrows are gene locus tags. Two big arrows in light gray consisting of several genes in red indicate the genes are co-transcribed. (B) shows relative transcription of genes in the cluster for E3, A2N, and R3N.

