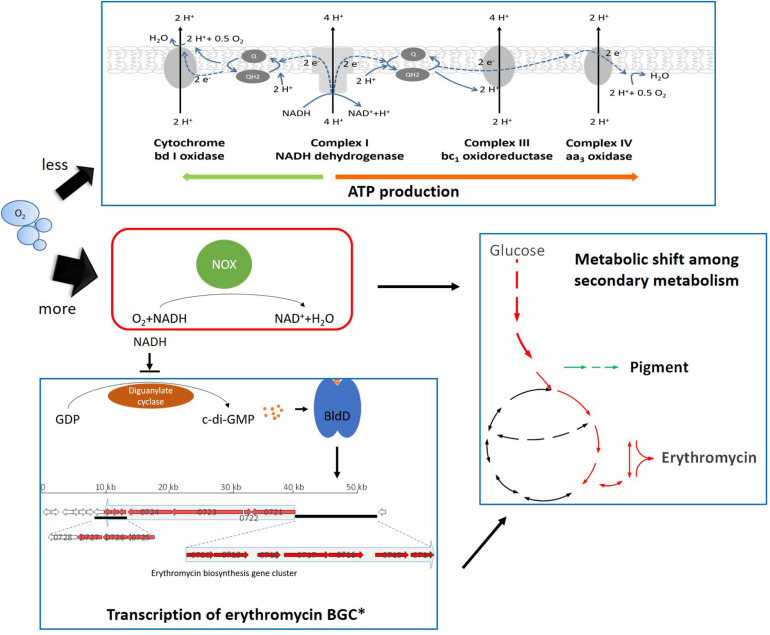
FIGURE 9.
Schematic representation of the cellular response toward the expression of NOX in S. erythraea. Black thin arrows refer to positive regulation; the thin arrows ended by a perpendicular short line refer to negative regulation. Green arrows beside Pigment indicates down-regulation, while red arrows beside Erythromycin indicates up-regulation. * refers to 2 previous studies (Chng et al., 2008; Xu et al., 2019).

