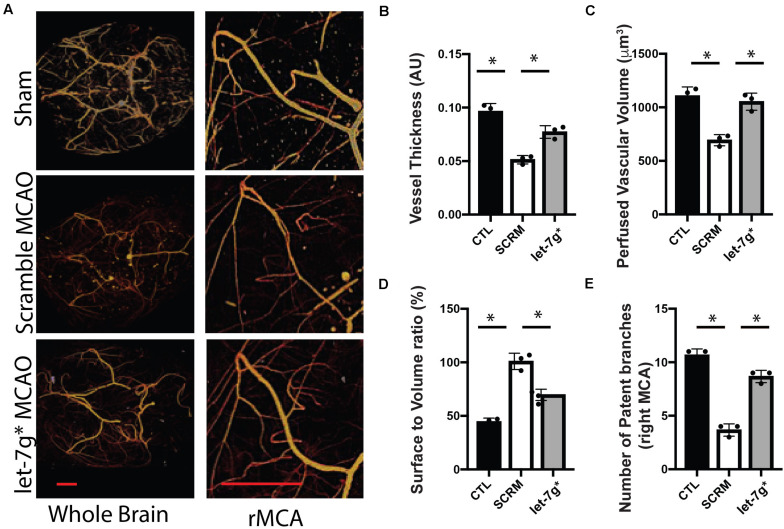
FIGURE 3.
let-7g* attenuates vascular damage after tMCAO. Cerebral neurovasculature following sham control or stroke was imaged with MicroCT, as detailed in section “Materials and Methods” (A). In right (tMCAO) hemisphere, the mean perfused vessel thickness was measured relative to control hemisphere (B), total volume of vascularized brain tissue (C), vascular surface area relative to perfused volume (D), and the number of patent branches originating from the right middle cerebral artery (E). Data are shown as mean ± SD. ∗p < 0.05. Scale bar = 1 mm.

