FIGURE 3.
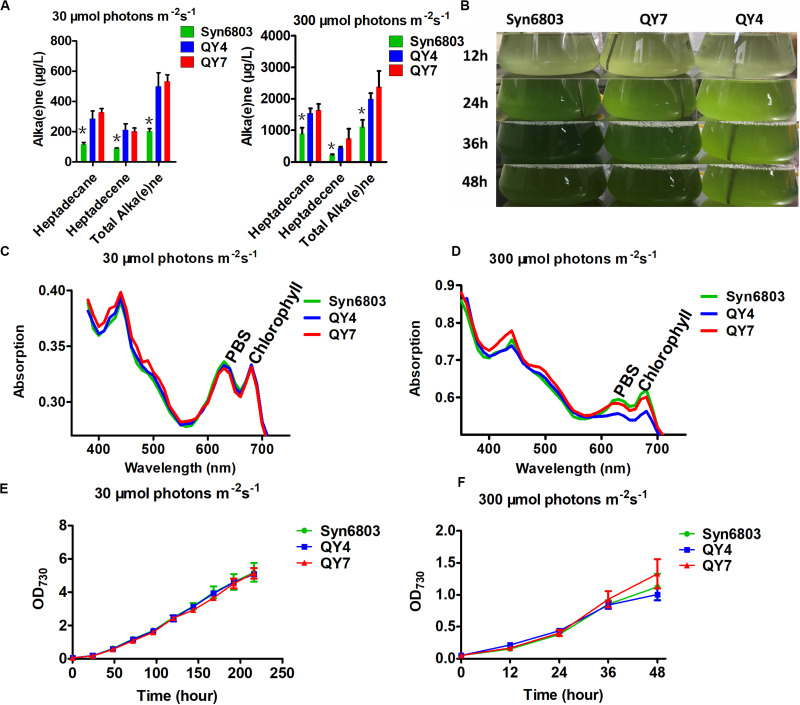
Alka(e)ne and phenotype of cyanobacterial strains under normal and high light. (A) Alka(e)ne contents in the three strains under normal and high light conditions. (B) Phenotypes of Syn6803, QY4, and QY7 strains under high light as a function of time. (C) Whole cell absorption spectra from 350 to 750 nm for Syn6803, QY4, and QY7 strains under normal light for 48 h at 30°C. The absorption spectra were normalized to OD730. PBS, phycobilisomes. (D) Whole cell absorption spectra from 350 to 750 nm for Syn6803, QY4, and QY7 strains under high light for 48 h at 30°C. The absorption spectra were normalized to OD730. PBS, phycobilisomes. (E) Growth curve of the three strains under normal light for 9 days. (F) The growth curve of the three strains under high light for 48 h. Error bars indicate the standard deviation of triplicate analyses. Asterisks indicate significant differences (Student’s t test, P < 0.05) of alka(e)ne contents between Syn6803 and the other two strains (QY4 and QY7). There was no significant difference between the alka(e)ne contents of QY4 and QY7 strain.

