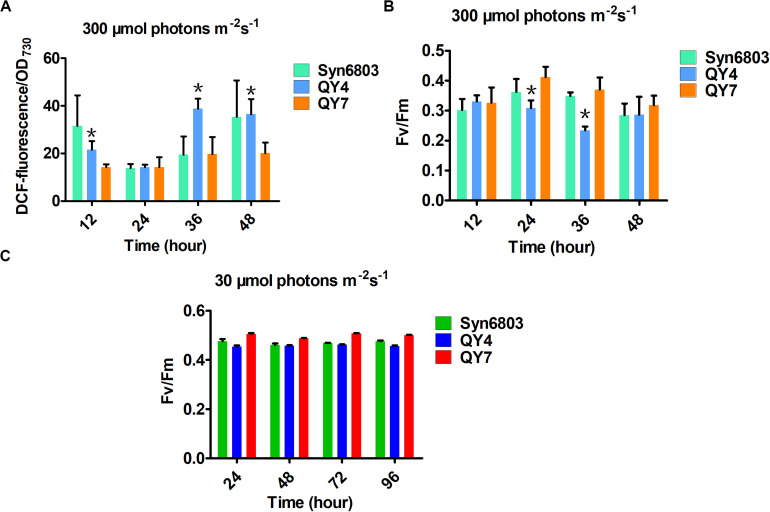
FIGURE 4.
Effects of light intensity on the tested cyanobacterial strains at different time points. (A) The intracellular ROS levels in the three tested strains under high light. (B) The ratio of Fv/Fm in the three tested strains under high light. (C) The ratio of Fv/Fm in the three tested strains under normal light. Error bars indicate the standard deviation from triplicate analyses. Asterisks indicate significant differences (Student’s t test, P < 0.05) between the data of QY4 and QY7 strain. There was no significant difference between the data of Syn6803 and QY7 strain.

