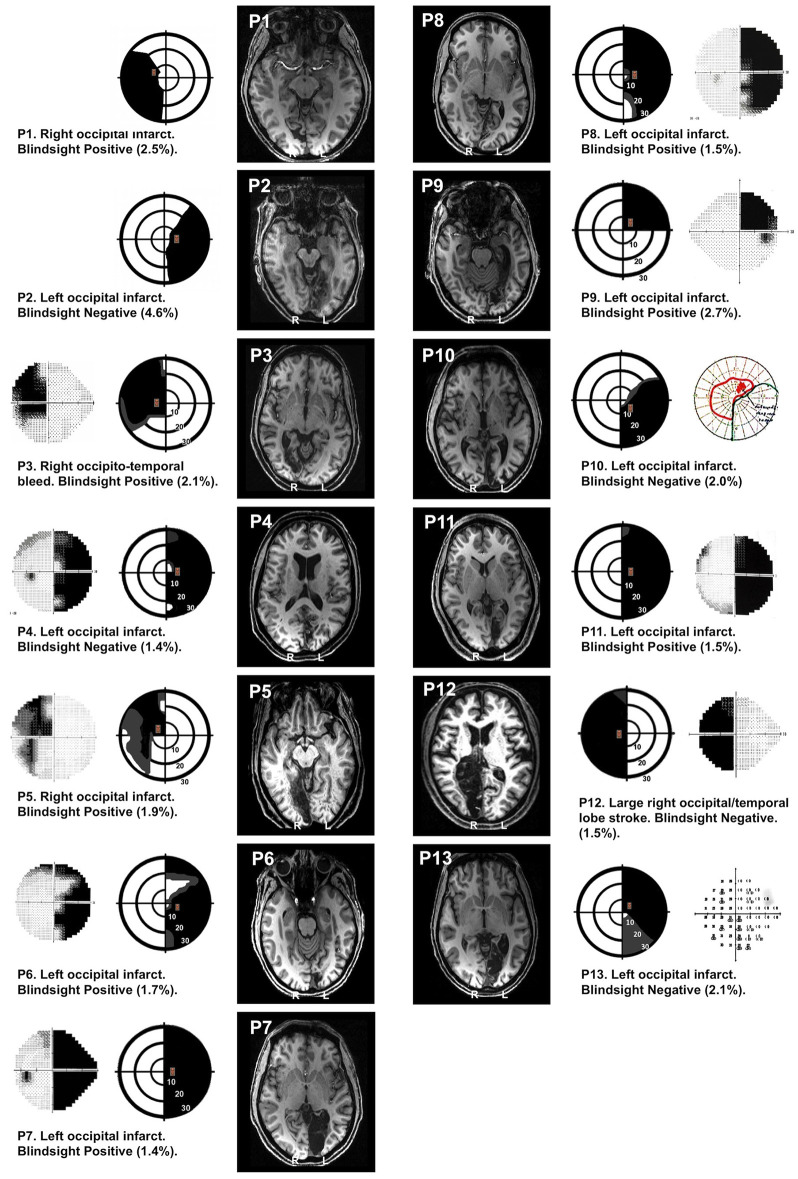
Figure 1.
Visual field loss and T1 structural images. In each patient, perimetry reports are depicted schematically showing the location of target stimuli. Dense visual field loss is shown in black (<0.5%) and partial loss in gray (<2%). Stimuli were restricted to a region of dense visual field loss, a minimum of 2.5 degrees from fixation. Concentric rings represent increments in retinal position of 10 degrees, spanning the central 30 degrees. Equivalent perimetry data (Humphrey 30:2 except P10, who has Goldmann) are shown alongside (outer columns) where available. Blindsight status and estimates of the percentage of scotoma covered by the stimulus (%) are provided for each patient. Representative T1 structural axial slices demonstrate the lesion location, using radiological convention.

