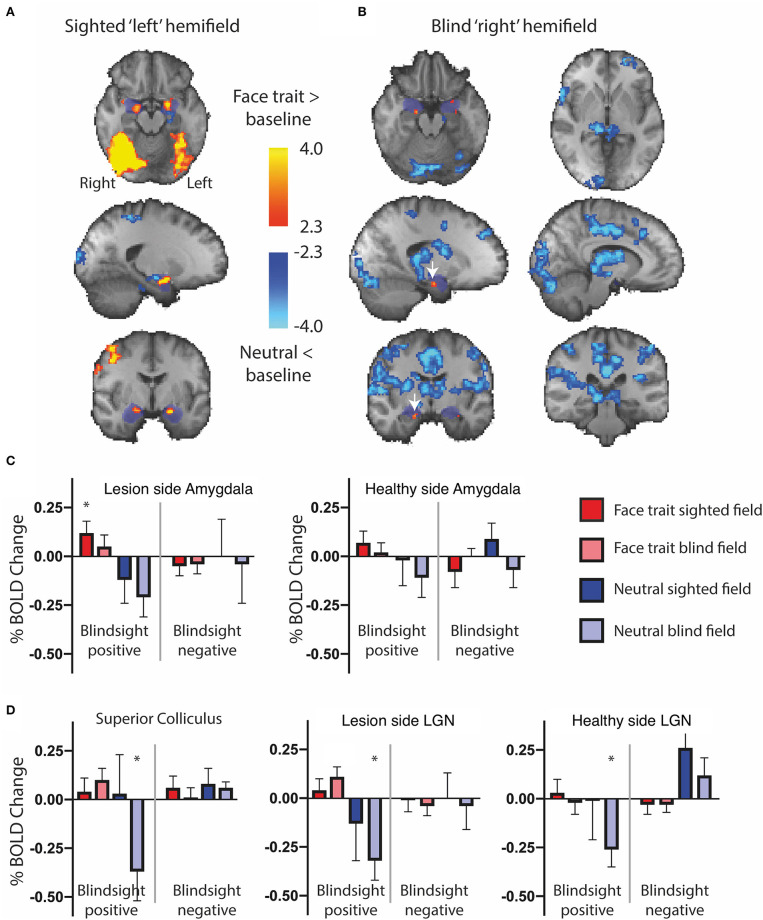
Figure 4.
fMRI activity for face traits and neutral conditions compared to baseline in patients with blindsight. (A) Significant activity for face traits above baseline (red), and neutral faces below baseline (blue) driving the contrast in Figure 3, for the sighted “left” field, and (B) blind “right” field. Mixed-effects analyses, P < 0.001 uncorrected for a priori regions of interest, elsewhere cluster corrected p < 0.01. The significant cluster in the “right” amygdala is indicated by white arrows. Shaded blue areas are binarized Jülich-defined probabilistic maps of the amygdala. Z-statistic range 2.3–4, and −2.3–4, radiological convention. (C) ROI analysis of signal change for face traits and neutral faces compared to baseline in the amygdala, (D) superior colliculus, and LGN comparing blindsight positive (left panels) to blindsight negative (right panels) patients. Error bars represent SEM. Statistical symbol * represents a response significantly difference from 0 at 0.05 level for one sample t-test.

