
Figure 1.
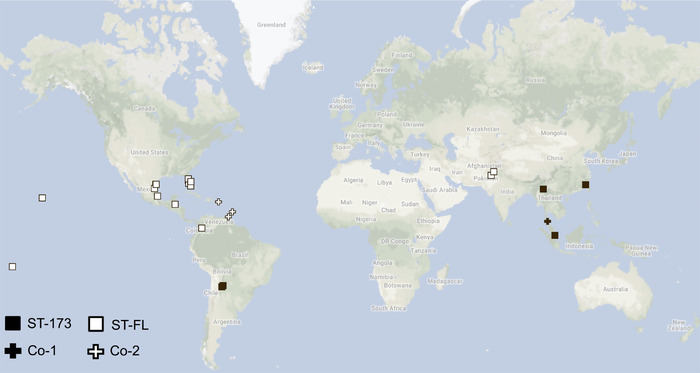
Distribution of Diaphorina citri populations with different Wolbachia (wDi) infection profiles. Symbols representing each infection profile are illustrated on the lower‐left. Created using Google Maps.
Official websites use .gov
A
.gov website belongs to an official
government organization in the United States.
Secure .gov websites use HTTPS
A lock (
) or https:// means you've safely
connected to the .gov website. Share sensitive
information only on official, secure websites.
Distribution of Diaphorina citri populations with different Wolbachia (wDi) infection profiles. Symbols representing each infection profile are illustrated on the lower‐left. Created using Google Maps.