Figure 2.

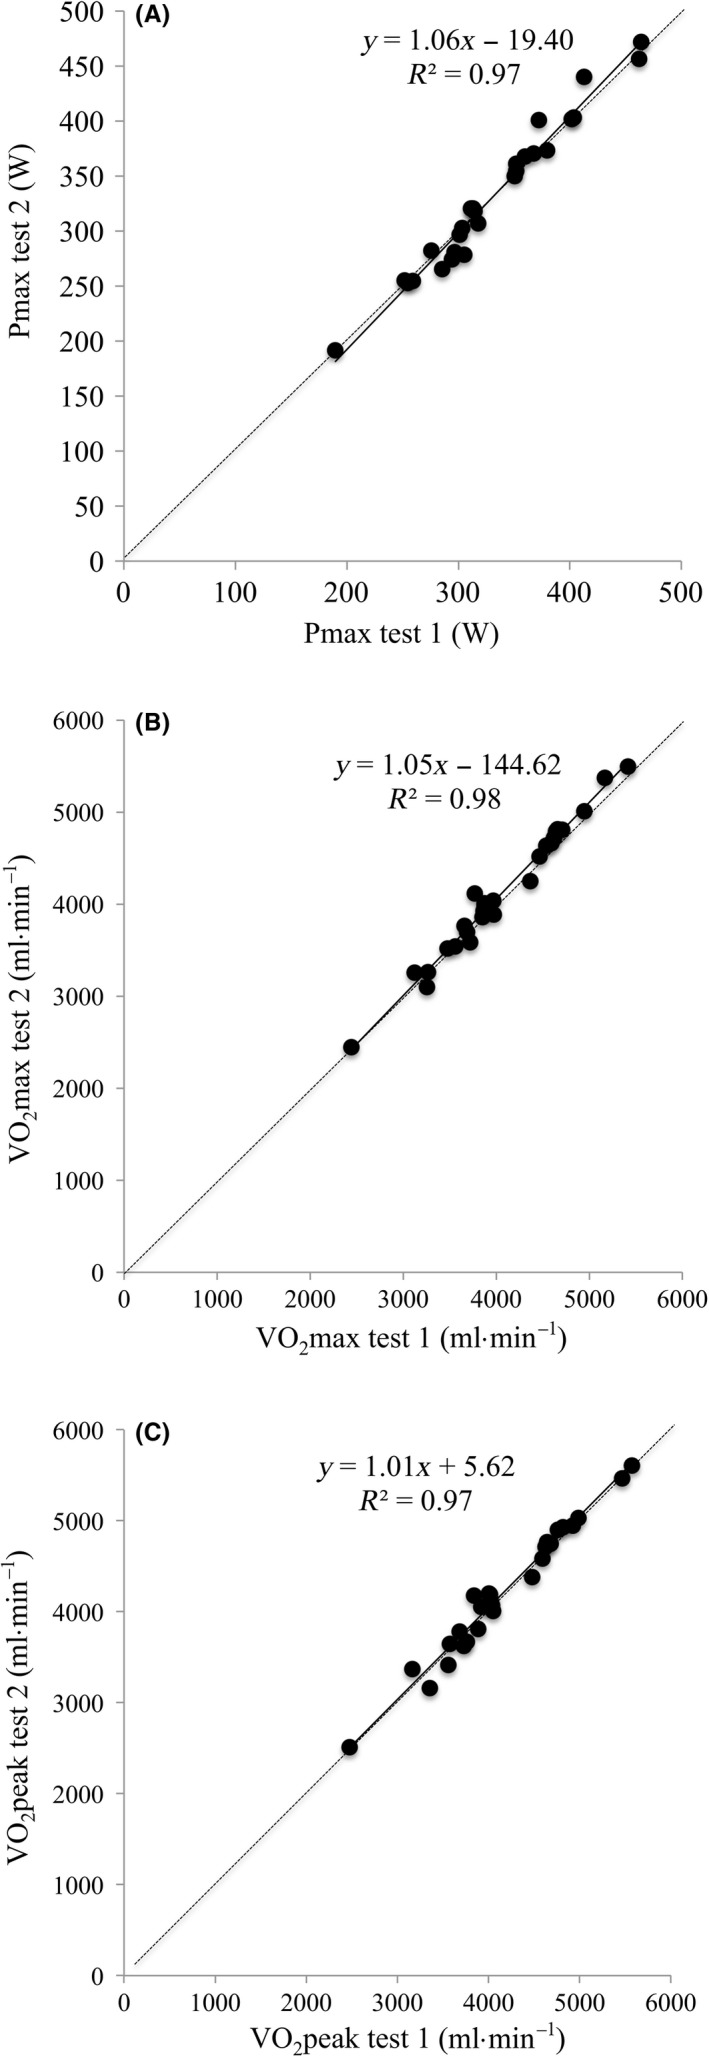
Scatterplot showing the test‐retest reproducibility in (A) P max, (B) VO2max and (C) VO2 peak as measured with the Omnical. The full line represents the regression line, and the dotted line indicates the line of identity

Scatterplot showing the test‐retest reproducibility in (A) P max, (B) VO2max and (C) VO2 peak as measured with the Omnical. The full line represents the regression line, and the dotted line indicates the line of identity