Figure 4.

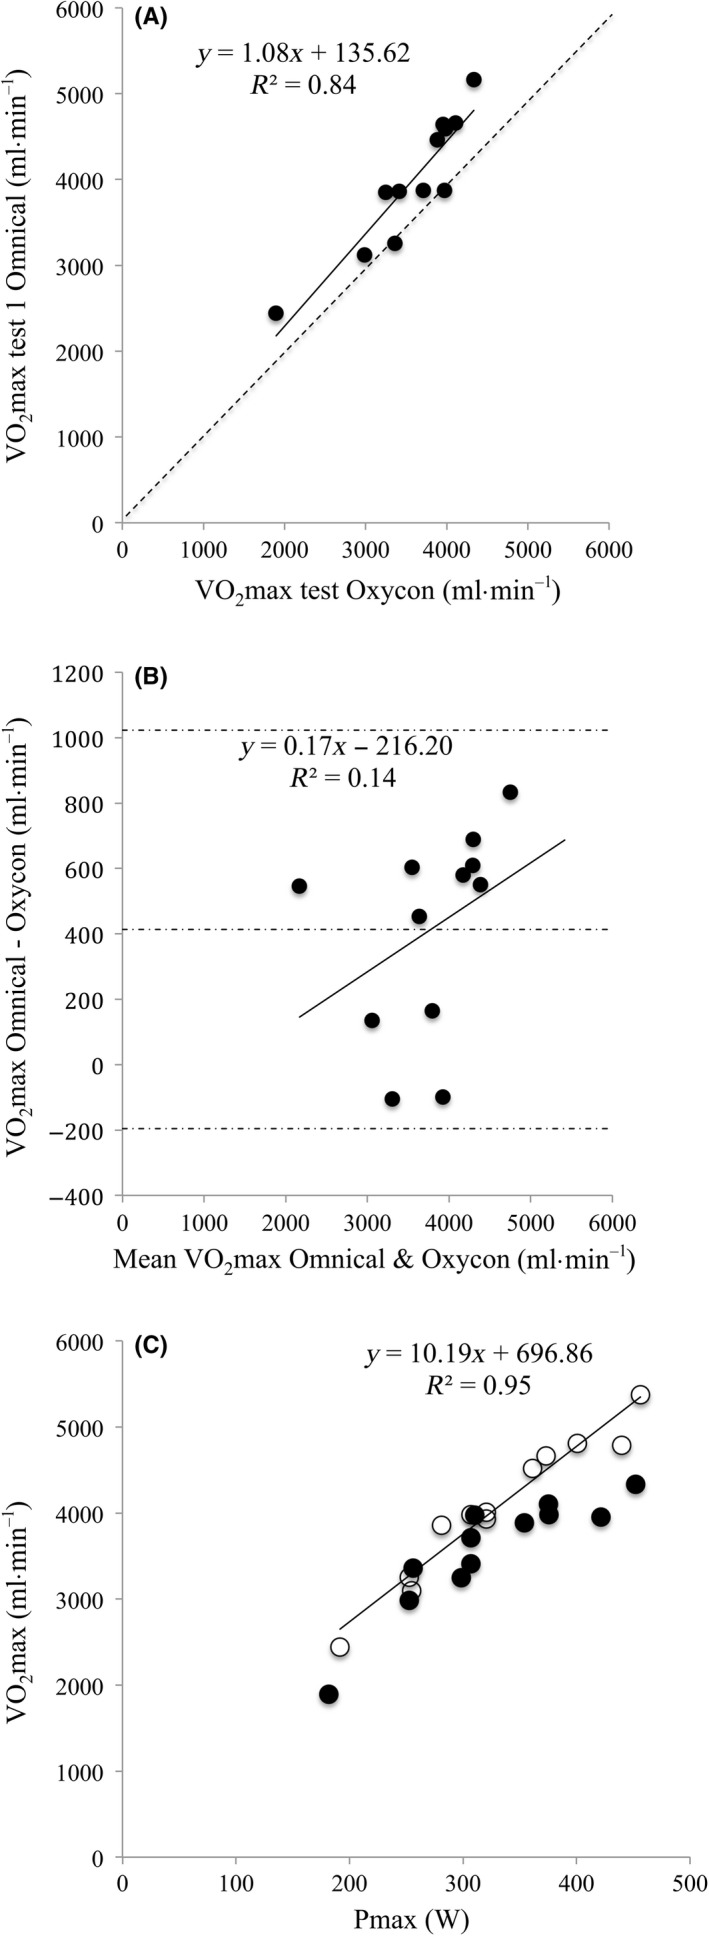
A, Scatterplot showing the test‐retest variability in VO2max between the Omnical and Oxycon Pro systems (n = 12). The solid line represents the regression line and the dotted line the line of identity. B, Bland‐Altman plot for VO2max as measured with the Omnical vs the Oxycon Pro system. Mean bias and 95% limits of agreement are indicated with dotted lines. The regression line shows there is a systematic bias that is proportional to the measured VO2max. C, VO2max plotted against P max for both the Omnical (open circles) and Oxycon Pro (closed circles)
