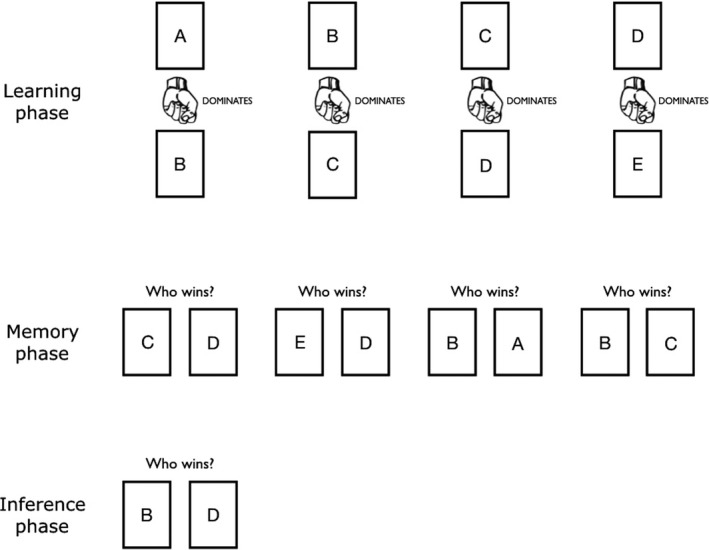
Figure 1.

A graphical flow chart of the task structure. Here we replaced pictures of faces with letters for ease of display. The actual task given to participants contained faces. The picture (fist) and text (‘dominates,’ ‘Who wins?’) match those of the dominance task. The age task similarly displayed a picture of a ruler and the text ‘is older than’, ‘Who is older?’. In the actual stimuli, the color of text was black, except in the inference phase, where text was red to distinguish it from the learning and memory phase. For original materials, see: https://osf.io/3vbky/
