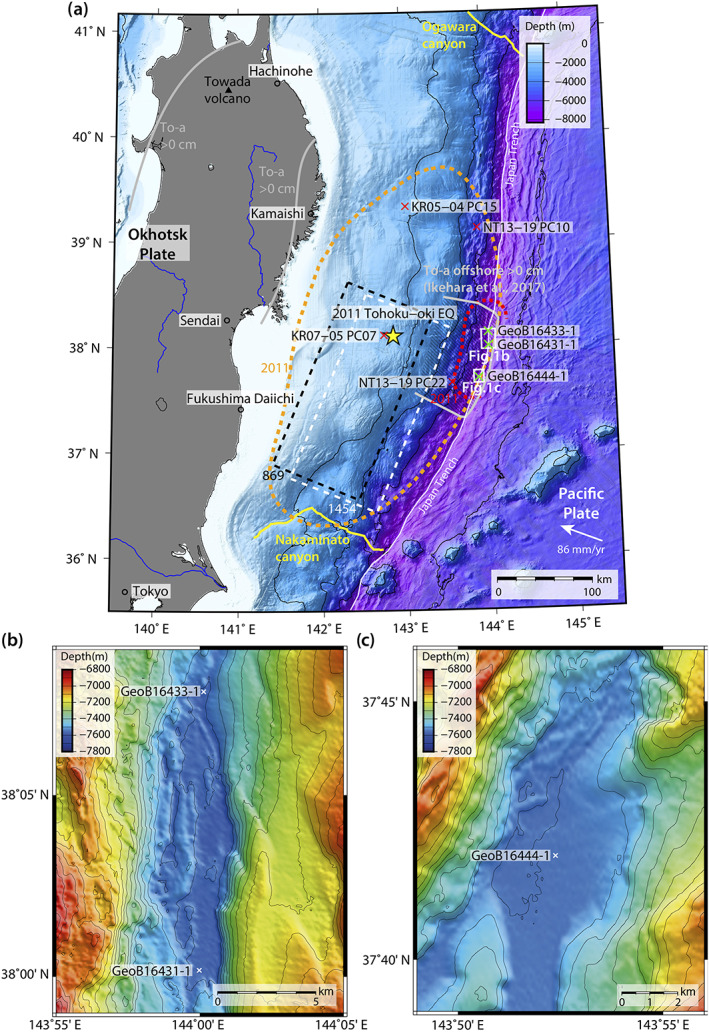
Figure 1.

(a) Overview map of the Japan Trench, East of Honshu, showing the epicenter of the 2011 Tohoku‐oki earthquake (Mw 9; yellow star) with the 2 m (Sun et al., 2017) and 40 m (Chester et al., 2013) coseismic slip (dashed orange and red line, respectively); reconstructed rupture areas of both the AD 1454 Mw ≥ 8.4 Kyotoku earthquake (white dashed line, Sawai et al., 2015) and AD 869 Mw ≥ 8.6 Jogan earthquake (black dashed line, Sawai et al., 2012); the deposition area of the To‐a tephra (gray solid line offshore with shaded area, after Ikehara et al., 2017 and gray solid line onshore after Machida & Arai, 2003); Nakaminato and Ogawara canyon in the south and north, respectively (yellow dashed line); the core locations of the three trench cores GeoB16444‐1, GeoB16431‐1, and GeoB16433‐1 (green crosses) along the central Japan Trench (cruise SO219A, 2012), and four slope cores (red crosses, after Ikehara et al., 2013, 2017; Usami et al., 2018); (b) bathymetric map of the northern central basin (contour lines 50 m) with the core locations GeoB16431‐1 and GeoB16433‐1; (c) southern central basin (contour lines 50 m) with core location GeoB16444‐1.
