
Figure 4.
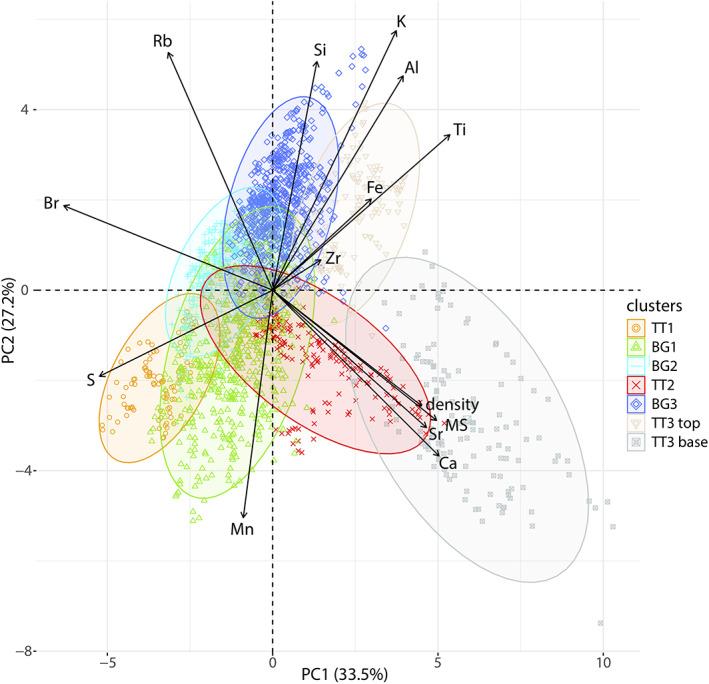
Biplot of PC1 (33.5%) and PC2 (27.2%), covering together >60% of the total data variation, colored in the seven clusters.
Official websites use .gov
A
.gov website belongs to an official
government organization in the United States.
Secure .gov websites use HTTPS
A lock (
) or https:// means you've safely
connected to the .gov website. Share sensitive
information only on official, secure websites.
Biplot of PC1 (33.5%) and PC2 (27.2%), covering together >60% of the total data variation, colored in the seven clusters.