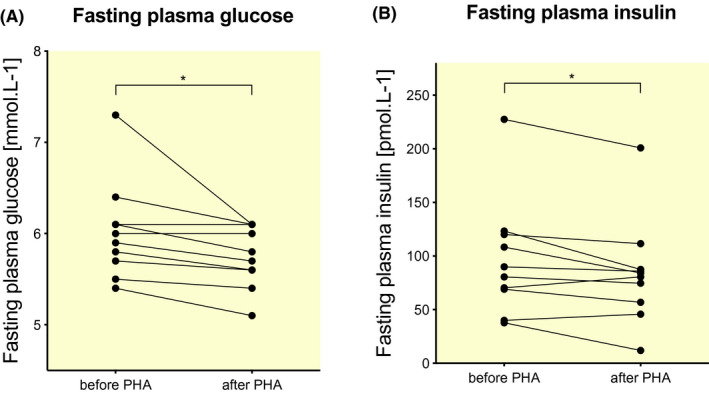
FIGURE 2.

Effect of PHA on fasting plasma glucose (A) and fasting plasma insulin (B) concentrations. Data are presented for each individual participant before and after PHA (N = 11). PHA, passive heat acclimation. * denotes P < .05 for pre‐PHA versus post‐PHA
