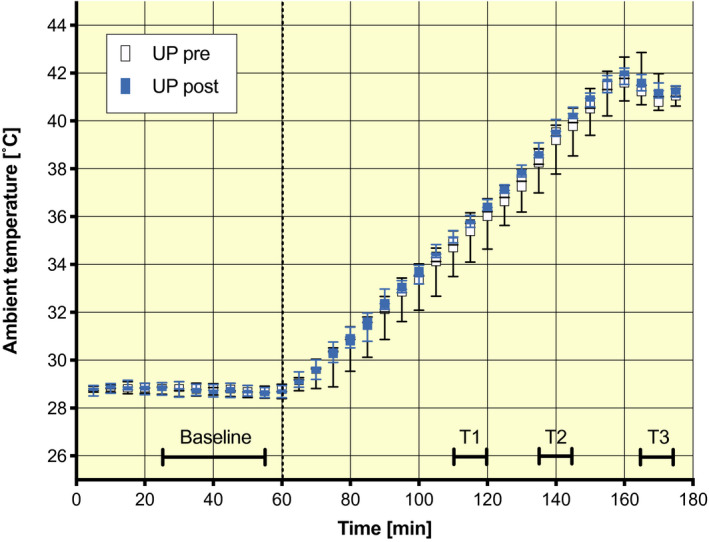
FIGURE 3.

Experimental conditions during the ramp protocol before and after acclimation. Four time intervals were selected to compare data before and after PHA (protocol time and ambient temperature in brackets): baseline (minutes 25‐55: 28.8 ± 0.15°C), T1 (minutes 110‐120: 35.4 ± 0.40°C), T2 (minutes 135‐145: 38.9 ± 0.49°C) and T3 (minutes 165‐175: 41.3 ± 0.33°C). T1 represents 50% of the ramp and approximates the acclimation temperature of 34.5 ± 0.16°C, and T2 and T3 were the minutes just before the investigators entered the climate chamber to take additional measurements for blood pressure, cardiac output and stroke volume. Whiskers represent min to max, the box extends from the 25th to the 75th percentile, and the middle line indicates the median. N = 11
