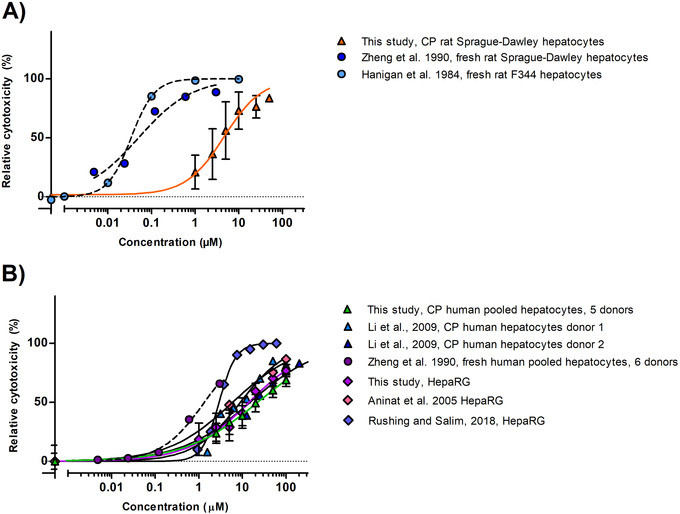
Figure 2.

Concentration response curves for the cytotoxicity of AFB1 (µm) in A) rat and B) human cell models upon 24 h exposure in medium without serum (mean values + SD) as measured in the present study and reported in literature. Circle symbols with dotted curves correspond to fresh hepatocytes. Triangle symbols to cryopreserved hepatocytes, and diamonds to HepaRG cells. CP: cryopreserved.
