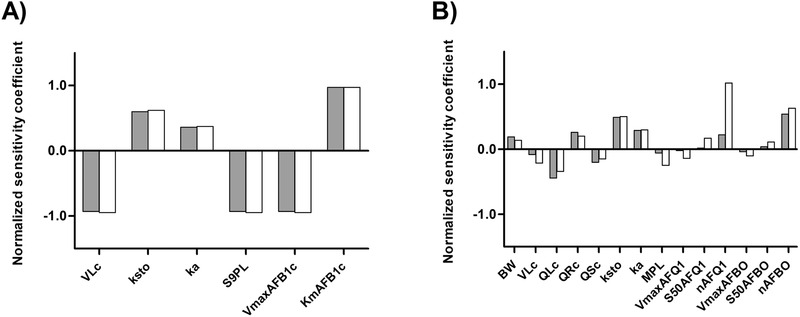
Figure 4.

Normalized sensitivity coefficients for the parameters of A) rat and B) human PBK model for AFB1. The sensitivity analysis for the rat model (A) was performed at single oral doses of 0.4 µg kg−1 bw (gray bars) and 5 mg kg−1 bw (white bars). The sensitivity analysis for the human model (B) was performed at single oral doses of 3.74 × 10⁻⁴ µg kg−1 bw (gray bars) and 120 µg kg−1 bw (white bars). VLc = volume of the liver, ksto = stomach emptying rate, ka = absorption rate constant, S9PL = scaling factor from liver S9 fraction to whole liver, VmaxAFB1c = V max of AFB1 conversion, KmAFB1c = K m of AFB1 conversion, BW = body weight, QLc = blood flow to liver, QRc = blood flow to rapidly perfused tissues, QSc = blood flow to slowly perfused tissues, MPL = scaling factor from liver microsomes to whole liver, V max AFQ1 = V max of AFQ1 formation, S50AFQ1 = S 50 of AFQ1 formation, V max AFBO = V max of AFBO formation, S50AFBO = S 50 of AFBO formation, nAFQ1 = Hill coefficient for AFQ1 formation, nAFBO = Hill coefficient for AFBO formation.
