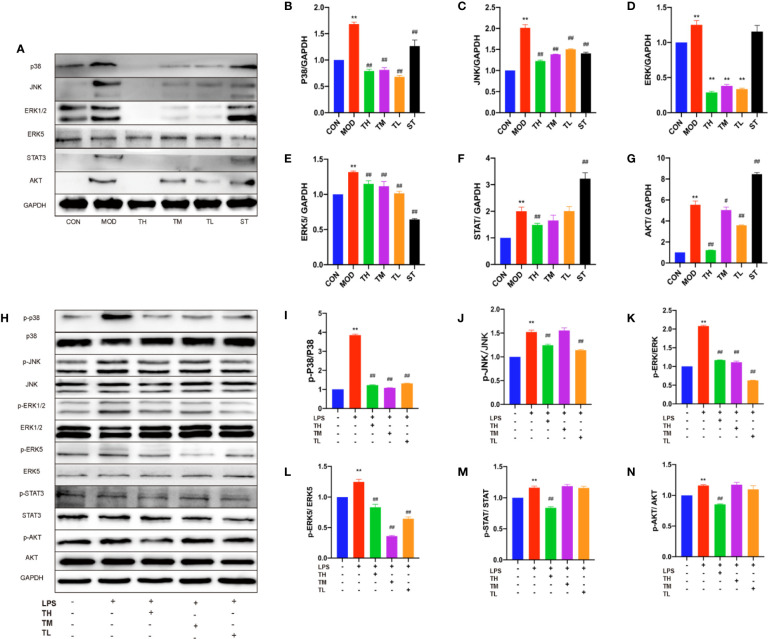
Figure 4.
Effects of THD on different signaling pathways in mice and LPS-induced RAW264.7 cells. Protein was extracted from mice aorta. Then p38, JNK, ERK1/2, ERK5, STAT3, and AKT were tested by western blotting assay (A). Protein was extracted from RAW264.7 cells. The total and phosphorylated levels of p38, JNK, ERK1/2, ERK5, STAT3, and AKT were determined by western blotting assay (H). The quantitative results were depicted (B–G, I–N). In Figures 4A–G, CON means control group, MOD means model group, TH means high THD group, TM means medium THD group, TL means low THD group, ST means Simvastatin group. Data are expressed as mean ± SD. ** P < 0.01 versus CON group; #P < 0.05, ##P < 0.01 versus MOD group. In the Figures 4H–N, TH means THD at 5 µg/ml concentration, TM means THD at 2.5 µg/ml concentration, TL means THD at 1.25 µg/ml concentration. Data are expressed as mean ± SD. **P < 0.01 versus group without LPS and THD; ##P < 0.01 versus group with LPS only.

