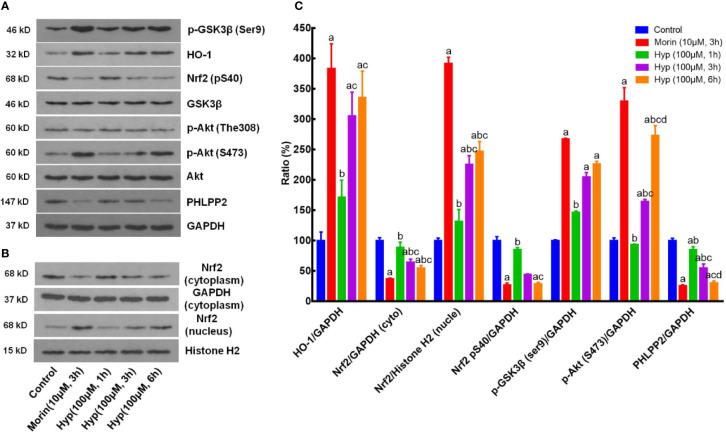
Figure 3.
Hyperoside regulation of the PHLPP2-AKT-GSK-3β signaling pathway in liver L02 cells. (A) Western blots. The cytoplasmic HO-1, p-GSK-3β, p-AKT, and PHLPP2 were analyzed using western blotting in liver L02 cells after treated with t-BHP. (B) Representative blots of cytoplasmic and nuclear Nrf2. (C) Quantification data of HO-1, cytoplasmic Nrf2, nuclear Nrf2, p-Nrf2 (S40), p-GSK-3β, p-AKT (S473), and PHLPP2. These western blots were quantified by using Image J Software and the data are expressed as mean and standard deviation (SD) and statistically analyzed by ANOVA. aP < 0.05 vs. Control, bP < 0.05 vs. Morin, cP < 0.05 vs. Hyp for 1 h, and dP < 0.05 vs. Hyp for 3 h.

