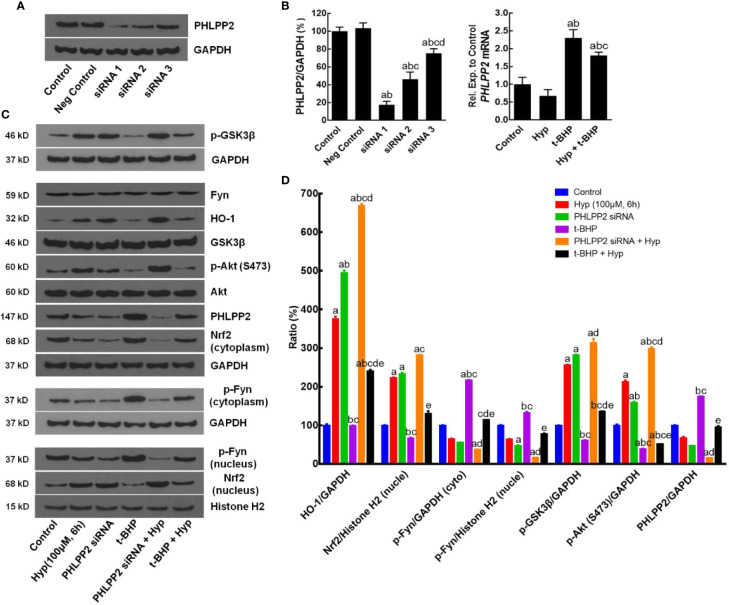
Figure 5.
Enhancement of Hyperoside-regulated PHLPP2-AKT-GSK-3β signaling pathway after knockdown of PHLPP2 expression in liver L02 cells. (A) Western blots. Levels of these different proteins were analyzed using western blotting in L02 liver cells after PHLPP2 siRNA1 transfection with or without t-BHP treatment. (B) Quantified data on PHLPP2 expression after PHLPP2 siRNA transfection (Left: protein expression; Right: mRNA expression). aP < 0.05 vs. the control, bP < 0.05 vs. the negative control, cP < 0.05 vs. PHLPP2 siRNA1, dP < 0.05 vs. PHLPP2 siRNA2. (C) Representative blots. (D) Representative quantification data on HO-1, nuclear Nrf2, cytoplasmic p-Fyn, nuclear p-Fyn, p-GSK-3β, p-AKT, and PHLPP2. These western blots were quantified by using Image J Software and the data are expressed as mean and standard deviation (SD) and statistically analyzed by ANOVA. aP < 0.05 vs. Control, bP < 0.05 vs. Hyp for 6 h, cP < 0.05 vs. PHLPP2 siRNA, dP < 0.05 vs. the t-BHP treatment, and eP < 0.05 vs. PHLPP2 siRNA + Hyp.

