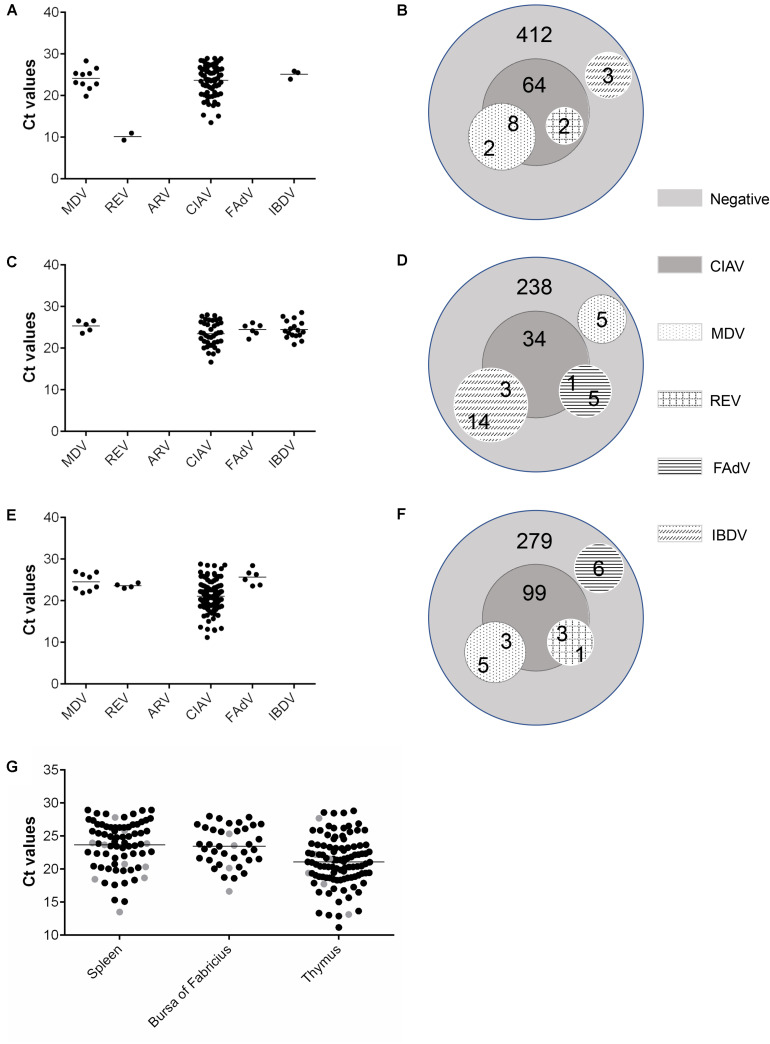
FIGURE 3.
Virus detection results from the MRT-qPCR assay of the 1,187 clinical samples. For the spleen (A,B), bursa of Fabricius (C,D), and thymus (E,F) samples, the Ct value of positive samples for each virus are shown with scatter plots (A,C,E). Each dot represents the mean Ct value of three duplicate in a positive sample. Coinfection samples are shown with Venn diagrams (B,D,F). (G) Distribution of Ct values of CIAV in three tissues under simple infection and coinfection. Each dot represents the mean Ct value of three duplicates in a positive sample. The Ct values of CIAV single infection are shown with black dots. Coinfection of CIAV with different viruses is shown with gray dots.

