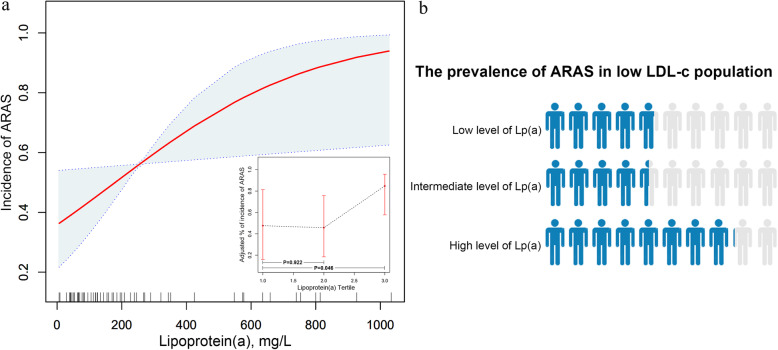
Fig. 2.
a. Non-linear relationship and tertile points between Lp(a) and ARAS adjusted covariates. Illustration: External image: the x-axis is Lp(a) concentration. The y-axis is the incidence of ARAS, with the shaded area representing a 95% confidence interval. (linear trend, P = 0.028). Internal image: the x-axis is Lp(a) concentration. The y-axis is the incidence of ARAS when dividing Lp(a) concentrations into three tertiles. The reference group (low Lp(a)) was set to 1.0. b. Population-based ARAS prevalence corresponding to different concentrations of Lp(a) levels in patients with low LDL-c levels. Illustration: Blue color indicates the prevalence of ARAS at different Lp(a) levels among a low LDL-c population.

