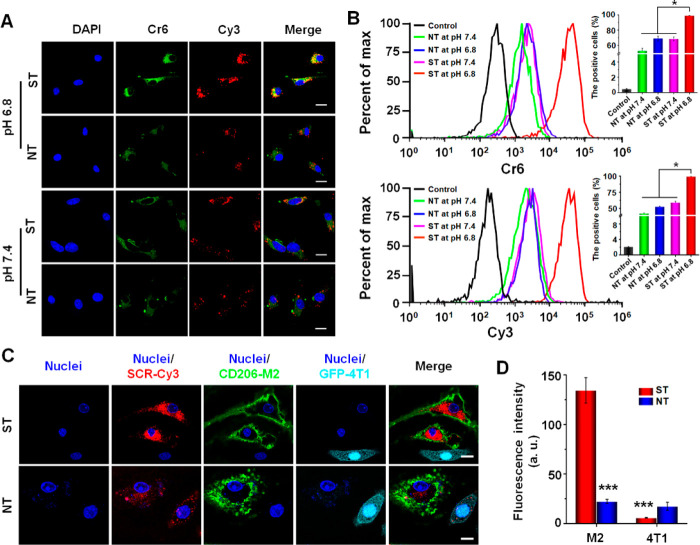
Figure 3.
Cellular uptake and intracellular distribution of micelleplexes in M2-like macrophages. (A) Confocal laser scanning microscopic (CLSM) imaging of M2-like macrophages incubated with ST-Cr6&Cy3 and NT-Cr6&Cy3 at pH 6.8 or pH 7.4 for 6 h. (B) Quantitative analysis of Cr6- and Cy3-positive M2-like macrophages by flow cytometry after cell incubation with ST-Cr6&Cy3 and NT-Cr6&Cy3 at pH 6.8 or pH 7.4 for 6 h. (C) CLSM imaging of M2-like macrophages and GFP-4T1 cancer cells coincubated with ST-Cr6&Cy3 or NT-Cr6&Cy3 at pH 6.8 for 6 h. Red fluorescence, Cy3-labeled scrambled siRNA (SCR); green fluorescence: GFP protein expressed in GFP-4T1 cancer cells; scale bars represent 10 μm. (D) Relative Cy3 fluorescence intensities in M2-like macrophages and GFP-4T1 tumor cells coincubated with ST-Cr6&Cy3 or NT-Cr6&Cy3 at pH 6.8 for 6 h. The Cy3 fluorescence intensity in GFP-4T1 tumor cells incubated with NT-Cr6&Cy3 was used for normalization. ***P < 0.001 vs ST in M2-like macrophages. Statistical graphs shown in part D are from the CLSM images shown in part C.

