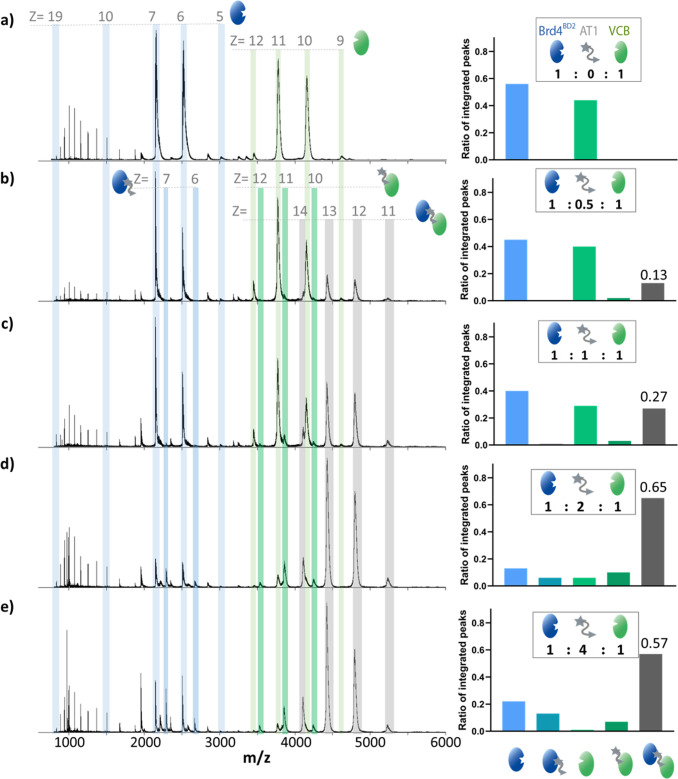
Figure 2.
Characterization of the equilibrium between VCB, AT1, and Brd4BD2 by nMS. nESI-MS of Brd4BD2 (5 μM, 15 036 Da) and VCB (5 μM, 41 376 Da) sprayed from ammonium acetate (100 mM, pH 6.8) and 0.5% DMSO at AT1 (971 Da) concentrations of 0 μM (a), 2.5 μM (b), 5 μM (c), 10 μM (d), and 20 μM (e). The insets show the estimated fractional ratios of the integrated peaks corresponding to apo-Brd4BD2, apo-VCB, and the indicated binary and ternary complexes, calculated by summing the intensity of each charge state corresponding to a particular species, and normalized to the summed intensity of all annotated peaks in the spectrum. In the case of apo-Brd4BD2 and binary MZ1-Brd4BD2 complex, only charge states [M + 6H]6+ and [M + 7H]7+ are used in the quantitative analysis (right). Bar charts are representative of a single measurement, so no error bars are shown in this case. Expected and measured masses of each species are reported in Table S1. At an equimolar ratio, the signal intensity of Brd4BD2 is higher than that of VCB due to higher ionization efficiency, better transmission inside the mass spectrometer, and/or more efficient detection as a result of its smaller mass and higher charge states.

