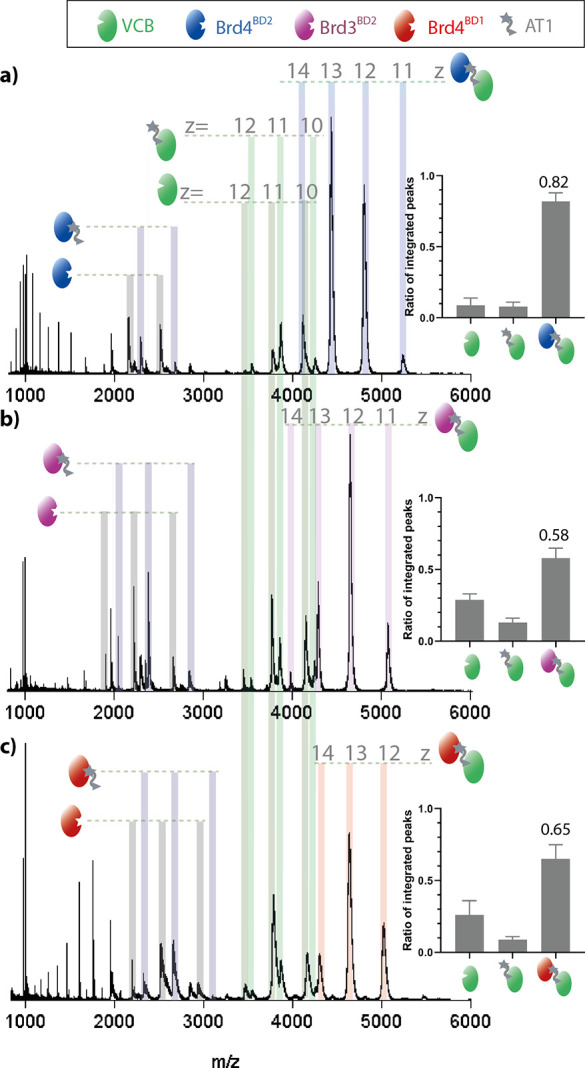
Figure 3.

nMS measurements showing the specificity of PROTAC AT1 for Brd4BD2. nESI-MS of VCB (5 μM), AT1 (10 μM), and Brd4BD2 (5 μM, a), Brd3BD2 (5 μM, b), or Brd4BD1 (5 μM, c). Proteins are sprayed from a starting solution of ammonium acetate (100 mM, pH 6.8) and 0.5% DMSO. Inset: estimated relative intensity of summed peaks corresponding to apo-VCB, binary AT1-VCB complex, and ternary complex substrate-AT1-VCB. Samples were analyzed in triplicate (see Figures S7–S9), and the error bars represent the standard deviation of the relative peak intensity. Fractional intensity of the signal corresponding to the ternary complex is shown.
