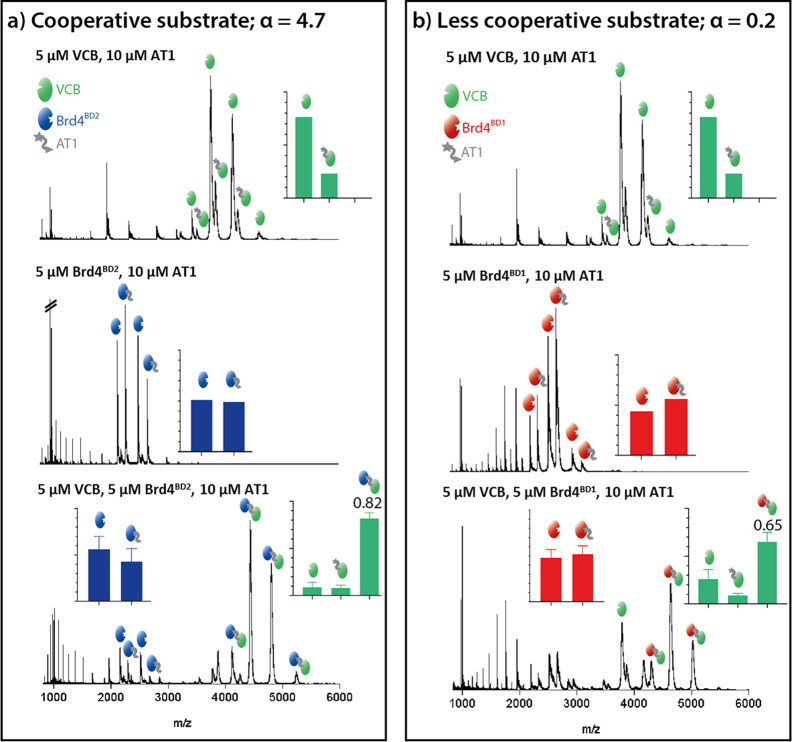
Figure 4.
nMS method testing PROTAC cooperativity. Top: VCB (5 μM) + AT1 (10 μM). Middle: substrate protein (5 μM) + AT1 (10 μM). Bottom: VCB (5 μM) + AT1 (10 μM) + substrate protein (5 μM). (a) PROTAC cooperativity with Brd4BD2 as substrate protein. (b) PROTAC cooperativity with Brd4BD1 as substrate protein. The insets show the estimated fraction of integrated peaks corresponding to the labeled species. For Brd4BD2, only the peaks which correspond to [M + 6H]6+ and [M + 7H]7+ are used for the quantification and, for Brd4BD1, only [M + 5H]5+, [M + 6H]6+, and [M + 7H]7+. Top and middle panels correspond to single measurements, while those in the bottom panel are the average of three measurements, with error bars representing standard deviations. Values for α (top) are taken from Roy et al.16

