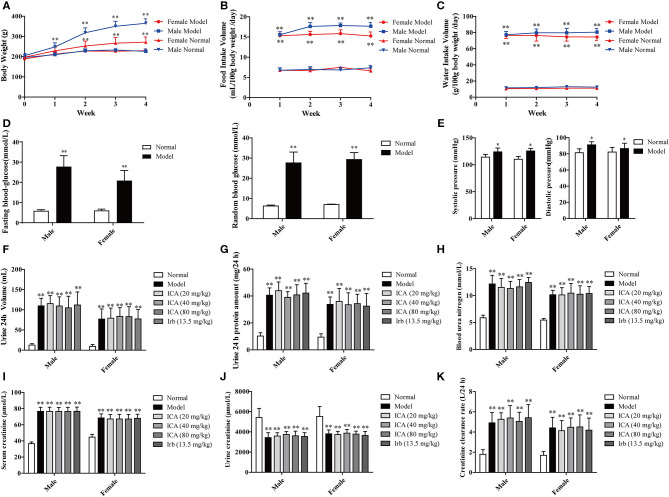
Figure 2.
Renal function in STZ-induced diabetic rats before administration. Four weeks after STZ administration, diabetic nephropathy models were examined based on general indicators. (A) Weight loss. (B) Food intake. (C) Water intake. (D) Blood glucose. (E) Blood pressure. (F) 24 h urine volume, (G) 24 h proteinuria, (H) Blood urea nitrogen (BUN), (I) Serum creatinine (Src), and (J) Urine creatinine (Ucr) were measured by ELISA. (K) Creatinine clearance rate. Data are expressed as mean ± SD. *p < 0.05, **p < 0.01, compared with the normal group.

