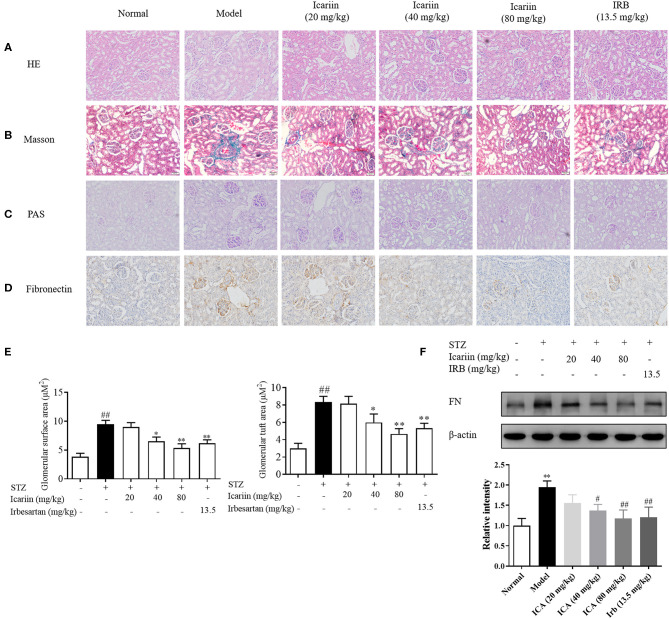
Figure 5.
Effect of icariin on the generation of ECM in STZ-induced diabetic rat. (A) The histopathology analysis of glomeruli using HE staining (200×). (B) The histopathology analysis of glomeruli using PAS staining (200×). (C) The histopathology analysis of glomeruli using Masson staining (200×). (D) Expression of FN in glomeruli through immunohistochemical (200×). (E) Glomerular surface area and glomerular tuft area were quantified using 30 glomeruli per mouse using ImageJ Software. (F) Expression of FN protein expression by western blot. Data are expressed as mean ± SD. *p < 0.05, **p < 0.01, compared with the normal control group; #p < 0.05, ##p < 0.01, compared with the Model group.

