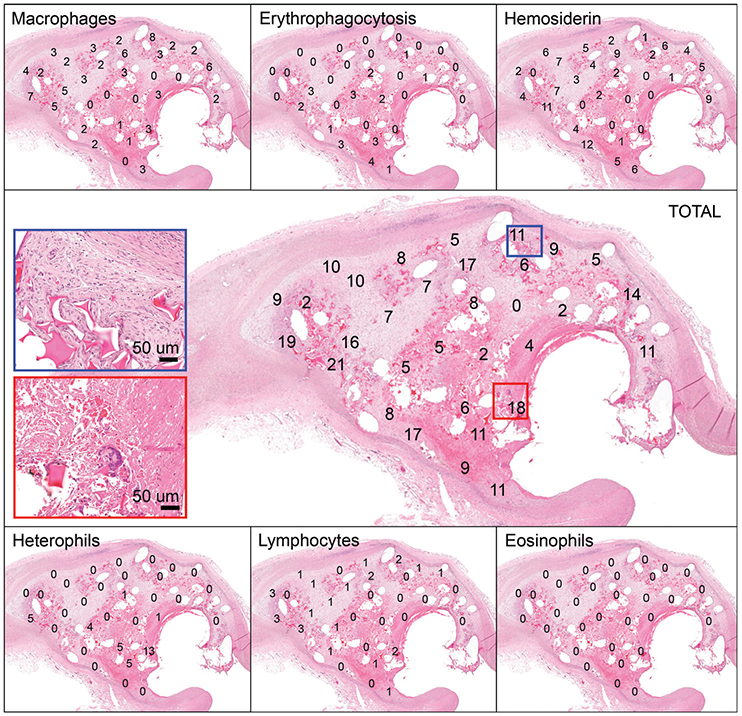
FIGURE 6.

Histology slide of aneurysm cross-section with cell counts displayed. Each panel depicts the same cross-section of an aneurysm, with the number of a specific cell type counted within a high power field (HPF) displayed. Each number within the panels along the top and bottom represents the number of that specific inflammatory cell type indicated (i.e., macrophage, erythrophagocytosis, hemosiderin-laden macrophage, heterophil, lymphocyte, or eosinophil) counted in that HPF. In this example, there are 32 HPFs examined. The panel in the middle represents the total number of inflammatory cells counted in each HPF (i.e., each number represents the sum of all cell types counted for that HPF from other panels). The blue rectangle indicates an HPF along the outer region that had increased numbers of macrophages (8/11 cells counted). The red rectangle indicates an area along the aneurysm neck with increased heterophils present (13/18 cells counted)
