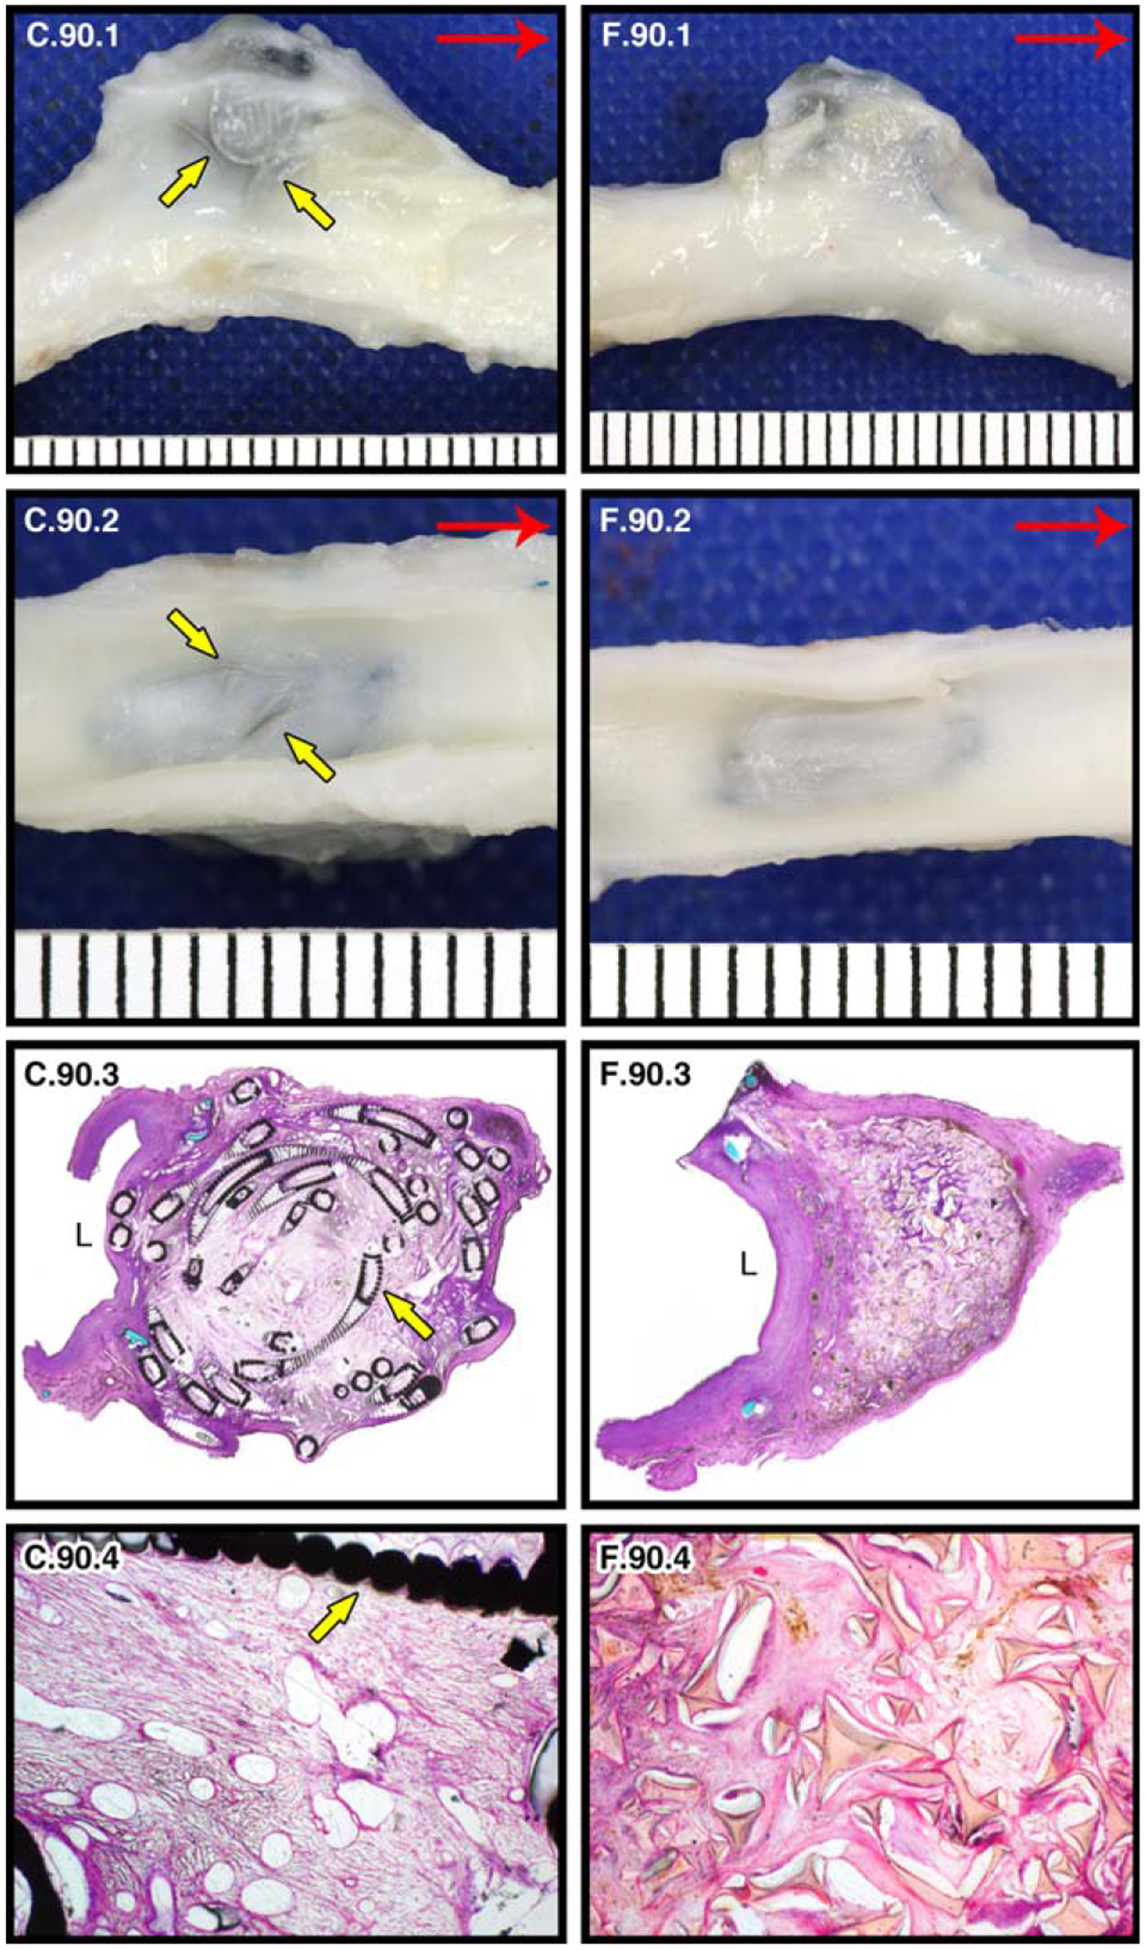
FIGURE 8.

90 day pathology of GDC-treated (c) and SMP foam-treated (f) porcine carotid artery sidewall aneurysms. Yellow arrows indicate coils. Gross images of left and right carotids at 90 days post implantation (red arrow indicates blood flow direction): lateral view of GDC-treated left carotid aneurysm (C.90.1); lateral view of SMP foam-treated right carotid aneurysm (F.90.1); En face lumenal views of aneurysms showing ostium of aneurysm sac (C.90.2, F.90.2). Histological evaluation of aneurysms bisected perpendicular to the long axis (“L” indicates the parent artery lumen): 2× H&E stained (C.90.3, F.90.3) and 10× H&E stained (central core; C.90.4, F.90.4) histology slides.
