Figure 2.
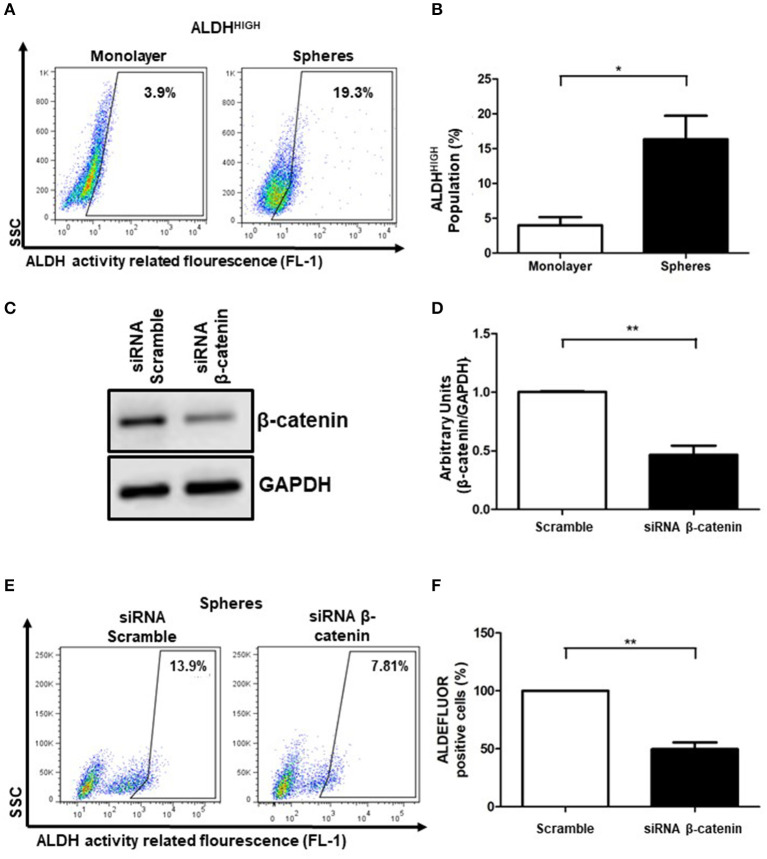
β-catenin is related to ALDHHIGH activity cell population. (A,B) Density plots showing the percentage of ALDHHIGH cells in SiHa cell line grown in monolayer or spheres cultures. The bar graph showed the percentages of ALDHHIGH cells in monolayer (white bar) or spheres cultures (black bar). The enzymatic activity of ALDH was measured by flow cytometry using the ALDEFLUOR kit. The inhibitor DEAB was employed as a background fluorescence control (data not shown). Data was normalized with DEAB (internal control) from 3 independent experiments are showed in bar graph (Means ± S.E.M.), *p < 0.05. (C) Western Blot of β-catenin in SiHa cells transfected with siRNA scramble (negative control) or siRNA β-catenin at 100 nM during 24 h. GAPDH was used as loading control. (D) The units were normalized with siRNA scramble and the densitometry quantification from 3 independent experiments are showed in bar graph (Means ± S.E.M), **p < 0.01. (E,F) Density plots showing the percentage of ALDHHIGH cells obtained of spheres cultures from SiHa cells transfected with siRNA scramble (left panel) or siRNA β-catenin (right panel). Transient transfection of SiHa cells using siRNA scramble (control) or siRNA β-catenin was employed to knockdown β-catenin. At 24 h post-transfection, SiHa cells were growth in spheres cultures for an additional 72 h. Each percentage of ALDHHIGH cells was normalized with DEAB as internal control. The percentages of ALDHHIGH cells with siRNA β-catenin were normalized to percentages of ALDHHIGH cells with siRNA scramble. The data from at least 3 independent experiments are shown in bar graph (Means ± S.E.M.), **p < 0.01.

