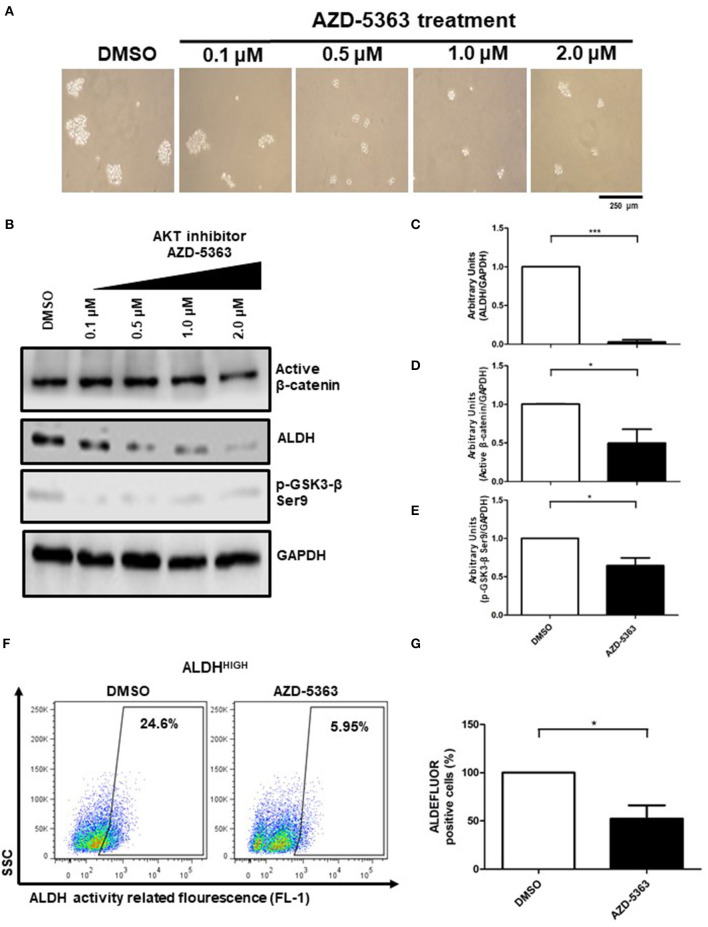
Figure 6.
The AKT activity is present in upstream β-catenin/ALDH axis. (A) Representative image of spheres size upon 0.1–2.0 μM AZD-5363 treatment. (B–E) Western Blot analysis of active β-catenin, p-GSK3-β Ser9, and ALDH protein from spheres treated with 0.1–2.0 μM AZD-5363, the bar graphs shown the comparation of control (DMSO) vs. 2.0 μM AZD-5363 treatment from 3 independent experiments (Means ± S.E.M.), *p < 0.05,***p < 0.001. (F) Density plots showing the percentage of ALDHHIGH cells in spheres treated with control (DMSO) or 2.0 μM AZD-5363 treatment for 72 h. (G) The bar graph shown the percentage of ALDEFLUOR positive cells in both conditions, DMSO and AZD-5363 treatment, considering 3 independent experiments (Means ± S.E.M.), *p < 0.05.

