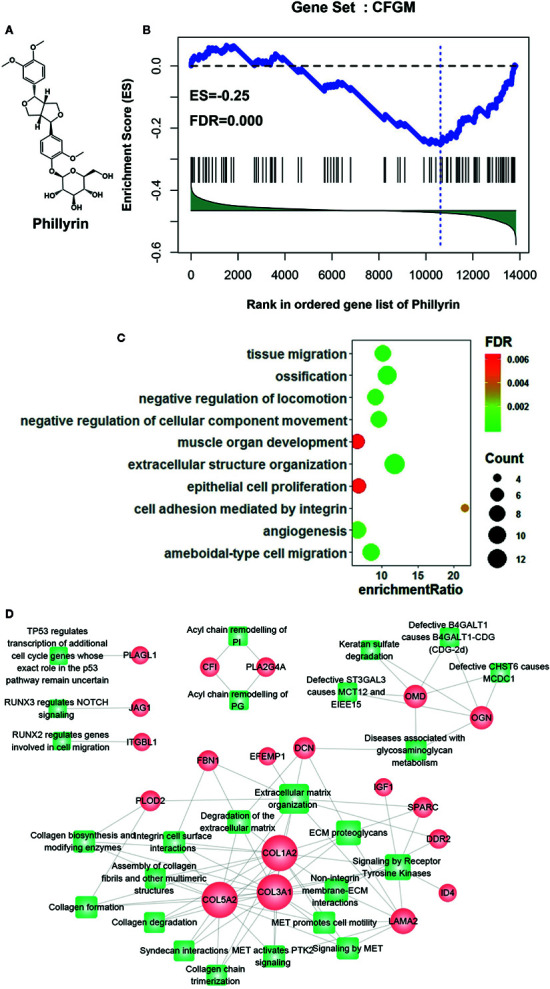
Figure 1.

Gene set enrichment analysis of CF-related gene functional module (CFGM) member genes in the phillyrin-induced gene expression profile. (A) 2D structure of phillyrin. (B) CFGM was significantly enriched at the bottom of the phillyrin-induced gene expression profile. The plot of the running enrichment scores (y-axis) for CFGM in the phillyrin-induced gene list ranked with differential values in descending order (x-axis) has been shown. The black dashed line denotes zero of the running enrichment score. The black vertical lines indicate the location of CFGM members in the gene list. The blue vertical line shows the location of the maximum enrichment score. (C) Enrichment analysis of the Gene Ontology (GO) biological process for the core genes in CFGM regulated by phillyrin. (D) The gene-pathway network was generated from the 47 phillyrin regulated genes and their related pathways in Reactome database (FDR < 0.05). Nodes represent genes (shown as circles) and pathways (shown as rectangles). A link is placed between a gene and a pathway node if the gene is involved in the pathway. The size of the node is proportional to the number of the network degree.
