
Figure 3.
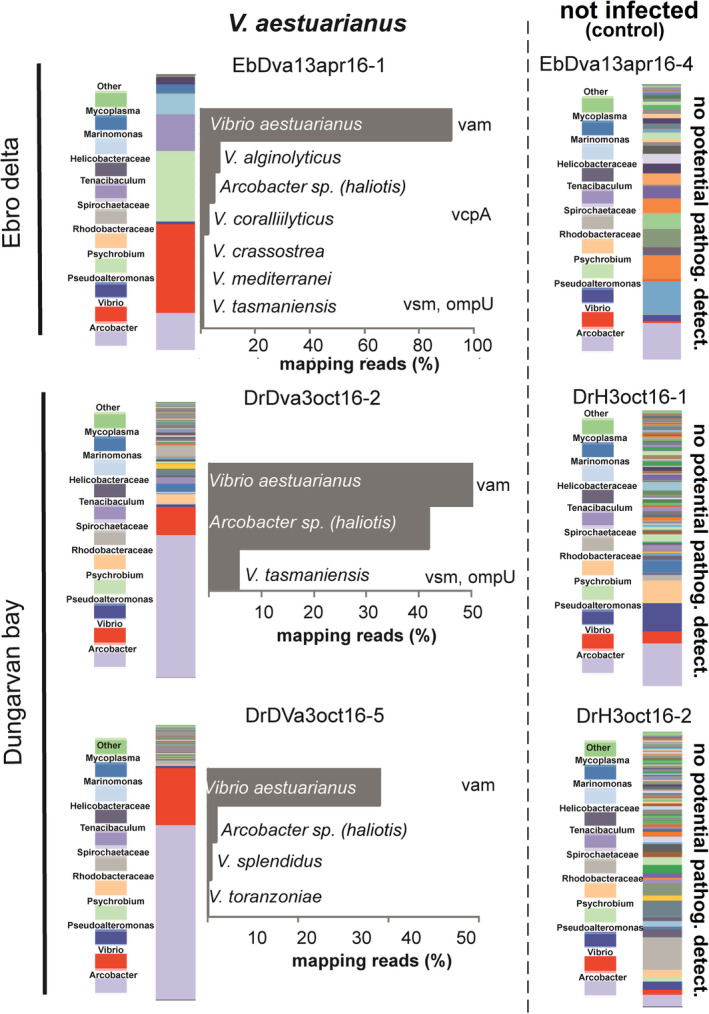
Results from target enrichment NGS analysis investigating C. gigas pathobiota in contrasting samples infected or not infected (control) by the bacteria V. aestuarianus. Relative abundance is calculated from the number of reads specifically mapping on target sequences and expressed as percentage (see main text for details on mapping parameters settings). Presence of virulence genes is also shown. [Color figure can be viewed at wileyonlinelibrary.com]