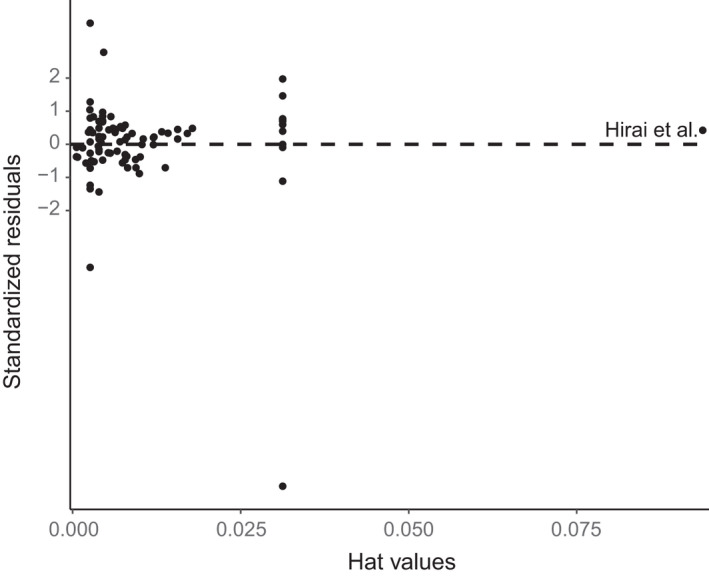
Figure 4.

Hat values of trials included within the meta‐analysis (a measure of influence on the meta‐analysis model plotted against standardized residuals). Outlying trials are labelled. Note the points correspond to trial‐level influence, not study‐level influence
